Step Size & Order Vs Accuracy
A MRKISS Library Example Program
| Author: | Mitch Richling |
| Updated: | 2025-09-10 16:56:40 |
| Generated: | 2025-09-10 16:56:41 |
Copyright © 2025 Mitch Richling. All rights reserved.
Table of Contents
1. Results
The code for this example is found in examples/step_order_vs_error.f90.
Additionally the code may be found at the end of this document in the section Full Code Listing.
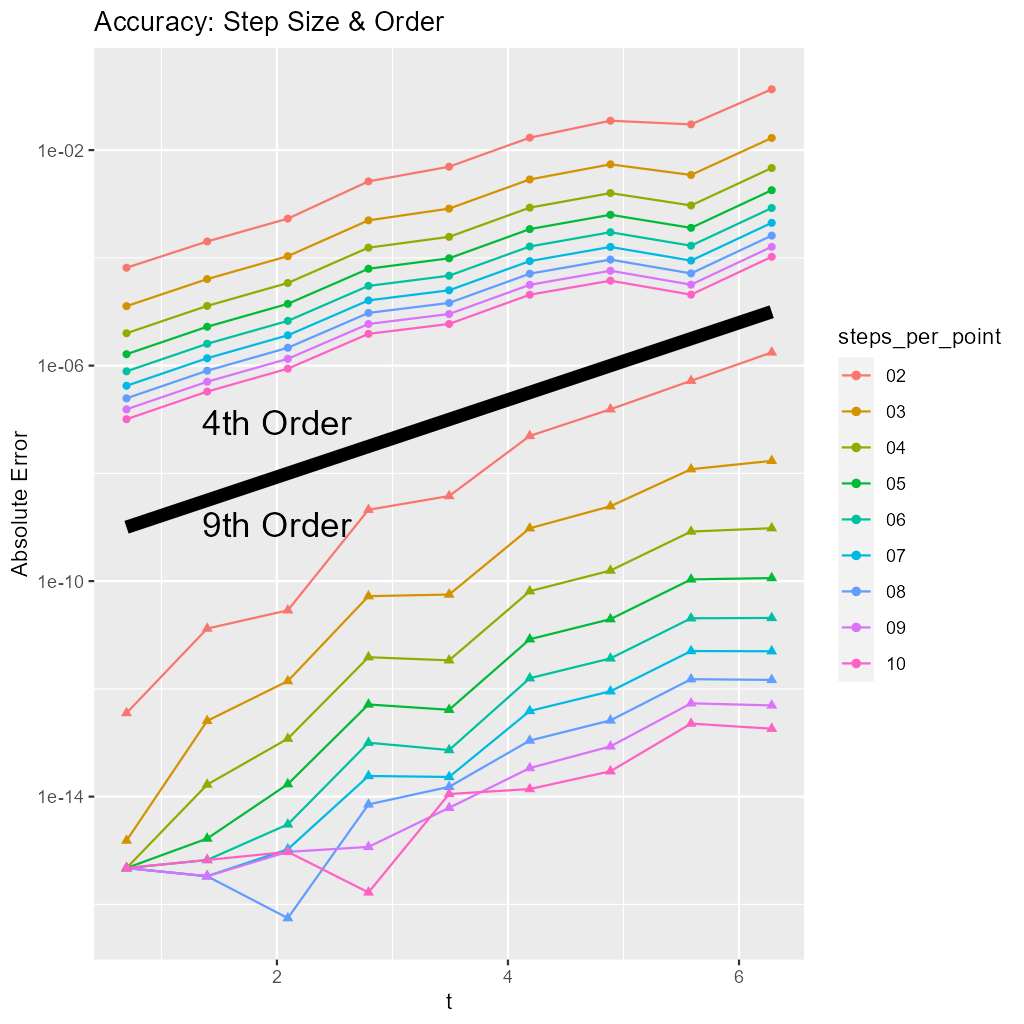
In this example we solve the same equation with two different Runge-Kutta methods – the classical \(\mathcal{O}(4)\) method and a newer \(\mathcal{O}(0)\) method. For each method we use 10 different step sizes.
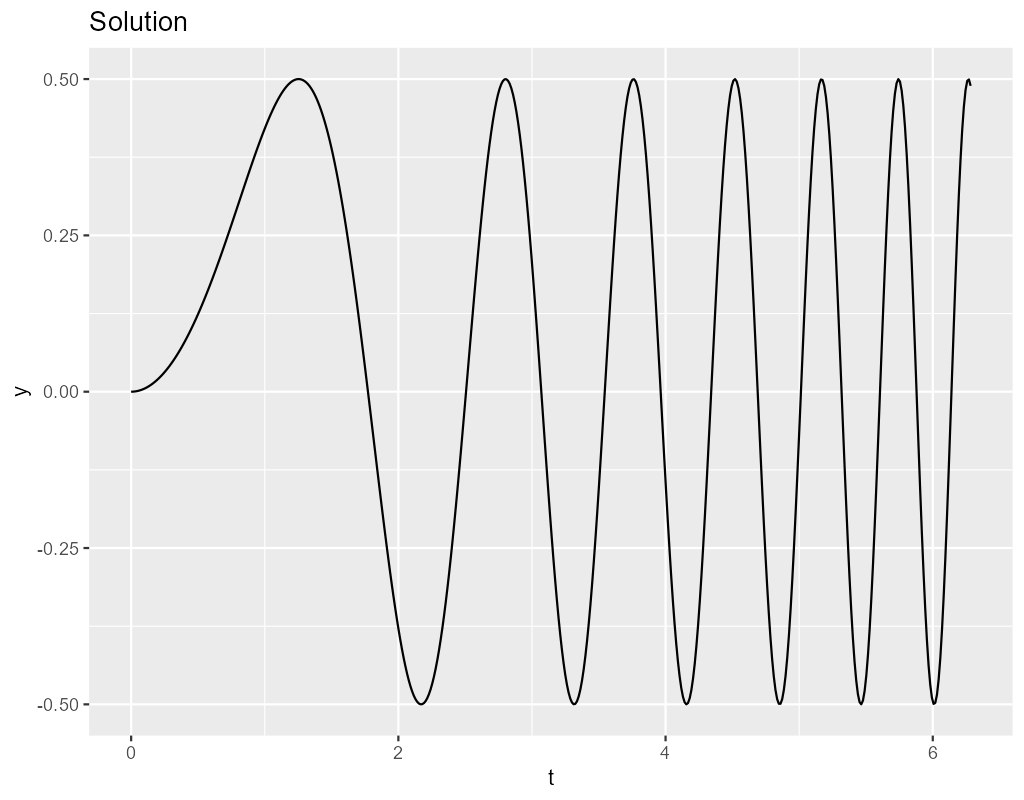
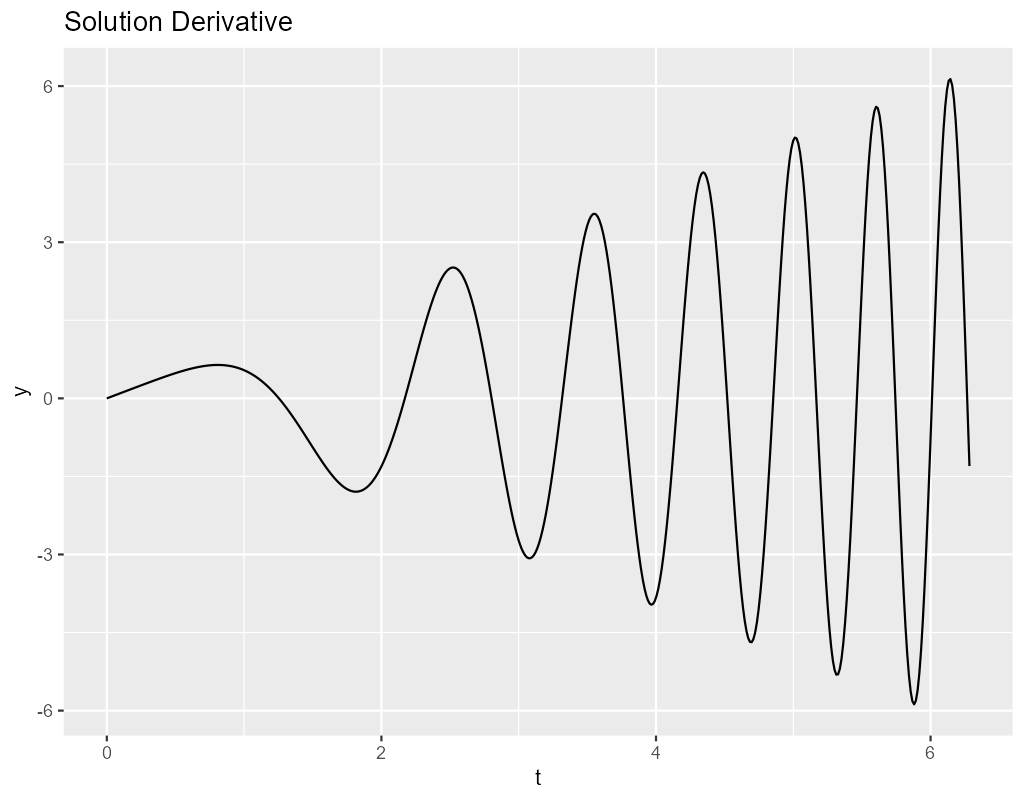
The system we solve: \[ y'=t\cos(t^2) \,\,\,\mathrm{with}\,\,\, y(0)=0 \]
We can solve this equation symbolically: \[ y'\frac{\sin(t^2)}{2} \]
Here are a copule plots
The system is solved at 10 points, using order 4 and 9 methods with between 1 and 10 steps per point. The impact on accuracy is summarized in the following plot:
2. Full Code Listing
2.1. Fortran Code
program step_order_vs_error

  use :: mrkiss_config,          only: rk, istats_size
  use :: mrkiss_solvers_wt,      only: fixed_t_steps, fixed_t_steps_between
  use :: mrkiss_utils,           only: print_solution, seq
  use :: mrkiss_erk_kutta_4,     only: a4=>a, b4=>b, c4=>c
  use :: mrkiss_eerk_verner_9_8, only: a9=>a, b9=>b, c9=>c

  implicit none

  integer,        parameter :: deq_dim       = 1
  integer,        parameter :: num_points    = 10
  real(kind=rk),  parameter :: y_iv(deq_dim) = [0.0_rk]
  real(kind=rk),  parameter :: param(2)      = [1.0_rk, 1.0_rk]
  real(kind=rk),  parameter :: pi            = 4.0_rk * atan(1.0_rk)
  real(kind=rk),  parameter :: t_start       = 0.0_rk
  real(kind=rk),  parameter :: t_end         = 2.0_rk * pi

  real(kind=rk)             :: solution(1+2*deq_dim, num_points)
  integer                   :: status, istats(istats_size), spp
  character(len=512)        :: filename

  call seq(status, solution(1,:), from_o=t_start, to_o=t_end)

  do spp = 1,10
     call fixed_t_steps_between(status, istats, solution, eq, y_iv, param, a4, b4, c4, spp)
     write (filename, '("step_order_vs_error_04_",i2.2,".csv")') spp
     call print_solution(status, solution, filename_o=trim(filename))

     call fixed_t_steps_between(status, istats, solution, eq, y_iv, param, a9, b9, c9, spp)
     write (filename, '("step_order_vs_error_09_",i2.2,".csv")') spp
     call print_solution(status, solution, filename_o=trim(filename))
  end do

contains

  subroutine eq(status, dydt, t, y, param)
    integer,          intent(out) :: status
    real(kind=rk),    intent(out) :: dydt(:)
    real(kind=rk),    intent(in)  :: t
    real(kind=rk),    intent(in)  :: y(:)
    real(kind=rk),    intent(in)  :: param(:)
    dydt = [ t * param(1)*cos(param(2) * t * t) ]
    status = 0
  end subroutine eq

end program step_order_vs_error
2.2. R Code
The images were produced with R.
crvDat <- data.table(t=seq(0,2*pi, length.out=500)) %>% mutate(truy1=sin(t*t)/2)
drvDat <- data.table(t=seq(0,2*pi, length.out=500)) %>% mutate(trudy1=t*cos(t*t))

truDat <- data.table(t=seq(0,2*pi, length.out=10)) %>% transmute(truy1=sin(t*t)/2)

solDat <- do.call(rbind, lapply(list.files(pattern = "^step_order_vs_error_[0-9][0-9]_[0-9][0-9]\\.csv$"),
                                function(f) {
                                  rko=first(strsplit(f, "[_.]"))[5];
                                  spp=first(strsplit(f, "[_.]"))[6];
                                  cbind(fread(f), truDat) %>%
                                    mutate(err=abs(y1-truy1), order=rko, steps_per_point=spp); })) %>%
  filter(i>1 & steps_per_point!='01')

gp <- ggplot(crvDat) +
  geom_line(aes(x=t, y=truy1)) +
  labs(title='Solution', x='t', y='y')
ggsave(filename='step_order_vs_error_soly.png', plot=gp, width=1024, height=800, units='px', dpi=150)

gp <- ggplot(drvDat) +
  geom_line(aes(x=t, y=trudy1)) +
  labs(title='Solution Derivative', x='t', y='y')
ggsave(filename='step_order_vs_error_sold.png', plot=gp, width=1024, height=800, units='px', dpi=150)

gp <- ggplot(solDat) +
  geom_line( aes(x=t, y=err, shape=order, col=steps_per_point)) +
  geom_point(aes(x=t, y=err, shape=order, col=steps_per_point)) +
  annotate("text", x = 2, y = 1e-8, label = "4th Order\n\n9th Order", color = "black", size = 6) +
  annotate("segment",
           x    = min(solDat$t),
           xend = max(solDat$t),
           y    = 1e-9,
           yend = 1e-5,
           linewidth=3) +
  scale_y_log10() +
  labs(title='Accuracy: Step Size & Order', x='t', y='Absolute Error') +
  guides(shape = "none")
print(gp)
ggsave(filename='step_order_vs_error_err.png', plot=gp, width=1024, height=1024, units='px', dpi=150)