Fortran Finance: Retirement Simulation
| Author: | Mitch Richling |
| Updated: | 2025-09-24 14:16:55 |
| Generated: | 2025-09-24 14:16:57 |
Copyright © 2025 Mitch Richling. All rights reserved.
Table of Contents
1. Introduction
One can go quite far in answering retirement questions using nothing more than TVM computations with fixed approximations for things like taxes, investment growth, and inflation. As retirement became more of a reality, I found myself asking questions these kinds of approximations simply couldn't address. So I wrote this little tool – it essentially simulates the annual financial transactions for a retired couple.
1.1. The Model
- Inflation can be a fixed rate or monte carlo.
- The couple have a fixed set of expenses to meet every year (a budget). This budget grows with inflation.
- Expenses are broken into shared expenses and expenses related to each person. Person specific expenses disappear when the associated person dies.
- Use the following sources in order for expenses: income, brokerage, IRA, Roth, & emergency fund.
- This draw down strategy leads to a dip in tax rate in the early years I can use to make Roth conversions.
- IRAs & Roth IRAs
- Never use an IRA (regular or Roth) if the account holder is <60.
- Never use a Roth IRA if the account was converted less than 5 years ago.
- The "never use" rules could lead to unpaid expenses – So be on the lookout for that, and adjust as required.
- They share a checking account in which they maintain a fixed balance growing with inflation.
- If necessary, savings in other accounts are used to maintain that balance using the same draw down strategy as expenses.
- Retirement Savings
- Each partner has an IRA and a Roth IRA
- They share a brokerage account
- Savings investments
- All accounts share the same blend of investments: high returns, medium returns, low returns, and cash position
- Each group has it's own return characteristics (fixed APR or monte carlo)
- All funds can be moved to the cash position if total assets are sufficient to meet future expenses under a worst case inflation condition.
- Each partner has a job.
- They each have a retirement date at which they will stop working.
- While they work, they contribute to to their IRA. Maximum contributions are comprehended including "catch up" contributions after age 50.
- Some percentage of unused income (income not used for expenses) can be saved in the brokerage account.
- Each partner will eventually draw Social Security
- They each have a year at which they will draw benefits.
- Benefits are expected to grow – this can be tied to inflation, or set to an alternate fixed rate.
- Taxes are estimated for each year including
- Income taxes
- Tax impact of IRA withdrawals
- Capital gains in the brokerage & emergency fund
- These are taxed in the year they are made at the short range rate
- Tax brackets are projected forward with inflation.
- They take the standard deduction. This is also projected forward with inflation.
- They file joint until one of them dies.
- Taxes are paid with the same strategy as expenses.
- They share an "emergency" fund invested in low risk investments.
- Funds used as a last resort.
- Return rate can be fixed or monte carlo
- Roth Conversions
- We convert part of IRA accounts to a Roth IRAs if that year's taxable income is below a set target.
- We convert p2 IRA accounts first, and then p1 IRA accounts.
- Life expectancy
- Can be automatically guessed from birth year & sex – Uses US SS actuarial tables
- Can be monte carlo – using US SS actuarial tables taking into account current age & sex
- Can be set to a fixed value. In this case, sex need not be provided in the config.
1.2. Model Analysis
As mentioned above, the primary tool is a simulator. The simulator dumps out the results of the simulation by year – account balances, taxes, expenses, account conversions, etc… You can analyze the data however you wish. I know many people will simply load it into Excel, but I have included an R script if that's your thing. This script will consume the output of the simulation, and produce a number of image files. I'll describe them here, but I think it's easier to just take a look at some examples.
1.2.1. When retire.out contains a single simulation (no monte carlo), then three visualizations will be produced:
savings_by_type.pngTotal savings over time broken out by savings typepaid_and_unpaid.pngAmount of living expenses & taxes that were successfully paidpaid_by_source.pngHow obligations were paid by payment source
1.2.2. When retire.out contains multiple simulations (monte carlo), then eight visualizations are produced:
death_distribution.pngHistogram for each person showing when they died in the simulationsfinal_savings.pngHistogram for final savings balance at deathprobability_of_failure_by_year.pngHistogram showing number of failure trajectories over timesavings_by_year_boxplot.pngBox plot showing total savings balance over time along with number of failuressavings_by_year_probability_bands.pngShows bands containing the given percentage of total savings balance trajectoriesprobability_of_success_by_year.pngLine plot showing the probability of failure over timecomposite_trajectories.pngComposite of total balance trajectoriesy10_savings.pngHistogram of 10 year balance broken out by success & fail trajectoriescomposite_trajectories_y10.pngComposite of ALL success trajectories zoomed in to the first 10 years
1.3. Some Observations
- Careful tax panning may be a larger factor in a successful retirement than portfolio mix!
- Proper portfolio mix and balancing is critical for maximizing income and minimizing risk.
- Roth conversions can be a huge deal in maximizing long term growth.
- Good visualizations are very important for understanding what's going on
- Monte carlo is an important component in understanding and mitigating risk, but it requires very careful analysis.
- Inflation really must be comprehended at every level.
1.4. Future Plans
- Add a way to remix investments later in retirement
- Add a way to change savings draw down later
- Main use case: Switch from IRA first to IRA/Roth mix to level out tax burden.
- Black–Scholes MC – this is mostly an academic curiosity for me.
- Social Security survivor benefits – not sure I really need this one.
- Back testing in addition to monte carlo – super low priority.
- Add support for annuity that begins upon retirement.
- Use case: RBA support with a perpetual annuity option
IRA to Roth IRA conversions(Completed 2025-01-10)Add 10 year US treasury bond yield(Completed 2025-01-06)Switch to correlated monte carlo. Yes. It's currently uncorrelated. That's bad. More of a bug really.(Completed 2025-01-07)Support systems without STDOUT redirection.(Completed 2025-01-08)Print error messages to STDERR instead of STDOUT(Completed 2025-01-08)Add support for progress messages to STDOUT(Completed 2025-01-08)Support different SSI benefit levels.(Completed 2025-01-08)Life Expectancy(Completed 2025-01-12)Life Table(Completed 2025-01-12)Add SSI Life tables module(Completed 2025-01-11)Data(Completed 2025-01-11)SSI male & female px * lx data(Completed 2025-01-11)CDC all, male, female, white people, white males, white females(Completed 2025-01-11)
Life table computations: Given age and qx or lx, compute: qx (when given lx), lx (when given qx), dx, Lx, Tx, ex, mx, & px(Completed 2025-01-11)Compute the maximum age a person might reach (the year at which everyone is dead in the life table)(Completed 2025-01-11)Compute probably a person at a given age a given number of years(Completed 2025-01-11)Add random generator that uses life table as the distribution. Take age into consideration.(Completed 2025-01-12)
simulation changes(Completed 2025-01-12)Option to set simulation end at highest survivor date in life table for sex of person(Completed 2025-01-12)Add graph showing probability of running out of cash by given date(Completed 2025-01-12)Add dots to the trajectory graph showing when both people died(Completed 2025-01-12)Do MC lifespan(Completed 2025-01-12)
1.5. Evaluating retirement planning software
I did a ton of research before I wrote this simulator. I looked at dozens of wealth management and retirement planning tools. Some free and some very expensive. Some super simple and some quite sophisticated. Some utterly terrible and some pretty good. In the end I have found myself using a couple online tools in combination with this simulator.
There is no universal measure of quality or fitness for these kinds of tools. At the end of the day it's all about your situation and goals that determine if a tool will help you or not. So, it is important that you do your research.
In this section I have documented some of the common issues I found with various tools without naming any names. My hope is that this list might help others in doing the same kind of research.
- Monte carlo deficiencies
- Not using historical data for simulation parameters.
- Seriously. I came across a couple client side JavaScript retirement calculators that were just doing uniform random numbers between -7 and 7 for market returns. That's pure trash.
- GBM (Geometric Brownian Motion) models with dubious parameter values.
- It's impossible to tell the difference between the result of an incorrect analysis of historical data and a made up number.
- It is impossible to trust this kind of simulation unless they disclose the source for parameters. My policy on this one is that if they won't share, then I can't trust them. It's that simple.
- Ignoring correlation
- Uncorrelated GBM models for blended investments – like bonds mixed with stocks.
- Ignoring the correlation between inflation and bond returns.
- Only doing MC on investment returns and not inflation.
- Poor visualization and analysis capabilities for the results of MC simulations.
- As I side note, I am convinced some of these tools exist only to publish the "probability of failure" metric as a marketing strategy. They hope to scare people into paying for a financial advisor.
- Unwillingness to divulge the underlying models and assumptions.
- This is a deal breaker for me. It's like the GBM parameter item above – if they won't tell, then I won't trust them.
- Note I'm not talking about "secret sauce" or "proprietary intellectual property". I'm talking about the essential information required to understand the results. How can we trust the "stock returns" MC if we don't even know what part of the market it's modeling? Is it comprehending dividends and splits as part of the adjusted rate of return? How is the REIT model incorporating dividends, and what is the reinvestment model?
- One thing to know: If they don't have it documented, then ask them. Many of the larger banks are more than willing to share this stuff. Frequently they don't have it in formal documentation posted on the web page, but they do have it readily available for advisors so they can communicate the answers.
- Not using historical data for simulation parameters.
- Poor tax estimation
- Blindly assuming a fixed tax rate over time is very common.
- Note that some of the large banks do this, but they tune the rate to you. They use your net worth and expenses to fit a fixed tax rate under the assumption of a savings draw-down strategy that will flatten out your taxes over time. So the fixed tax rate thing isn't always bad, but you need to make sure the tool is being intelligent and not just "blindly picking a number".
- Not adjusting tax brackets for inflation.
- Inability to specify tax filing status and deduction methodology.
- Not considering age related early withdrawal penalties for retirement accounts.
- Blindly assuming a fixed tax rate over time is very common.
- Roth conversions
- Most tools simply don't have the ability to plan for them at all
- Failing to comprehend the 5 year withdrawal penalties
- Failing to correctly compute tax consequences at time of conversion.
- Social Security
- Not comprehending when one partner dies, or only having one SSI monthly value for the couple.
- Not supporting, or incorrectly supporting, survivor benefits.
- Most tools don't allow you to use MC on life span
- Data security & privacy
- Make sure they have a published privacy policy. If they don't, assume anything you give them will be sold.
- Do your best to verify data security.
2. Examples
2.1. Just Starting Out
Here we have a couple starting to save for retirement at age 25. They both have good jobs earning 100K, and they spend 100K per year on expenses. Work income is growing at 2.5%. They currently have no retirement savings, but wish to start saving aggressively. They believe they can earn 4% on investments, and inflation will be about 3%. Note work income is not keeping up with inflation. They have 10K in checking and 10K in an emergency fund. The checking account earns 0.01% interest, and the emergency fund is in CDs earning 3%.
2.1.1. Fixed
The graphs in this section are what you get from retire.R when the simulation has no monte carlo. This is similar to what most retirement calculators will
generate.
This first graph simply shows total savings balance by account type.

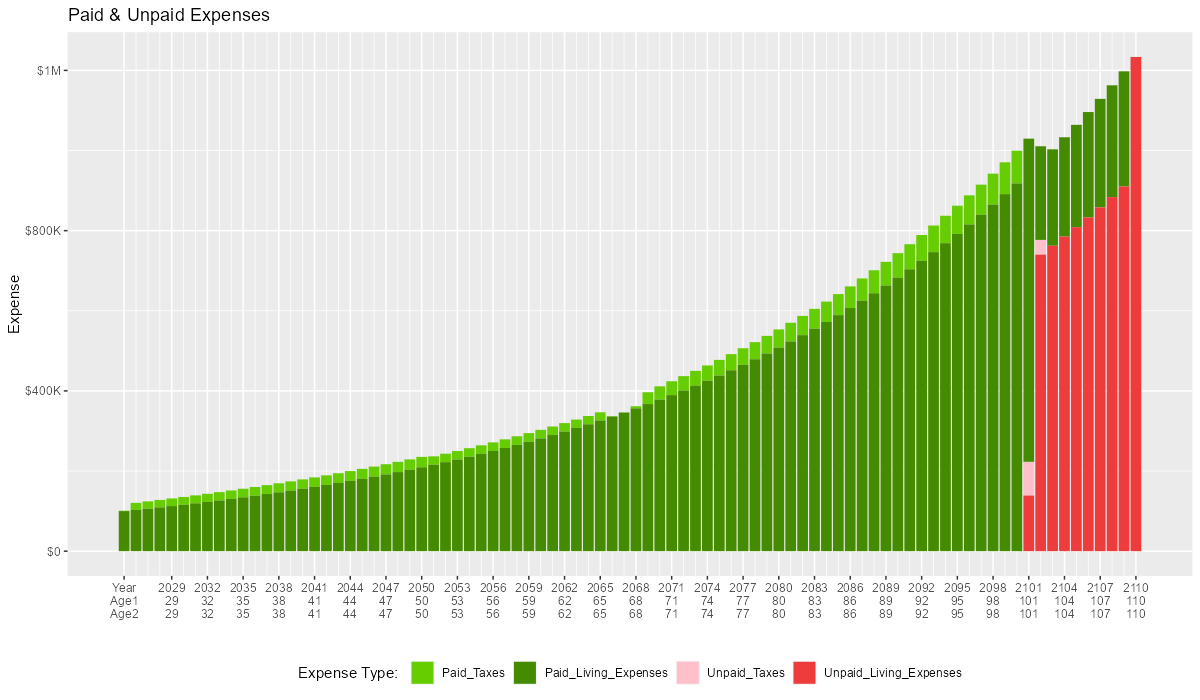
This graph shows us paid vs unpaid expenses. Expenses are broken into two categories (taxes & living expenses).
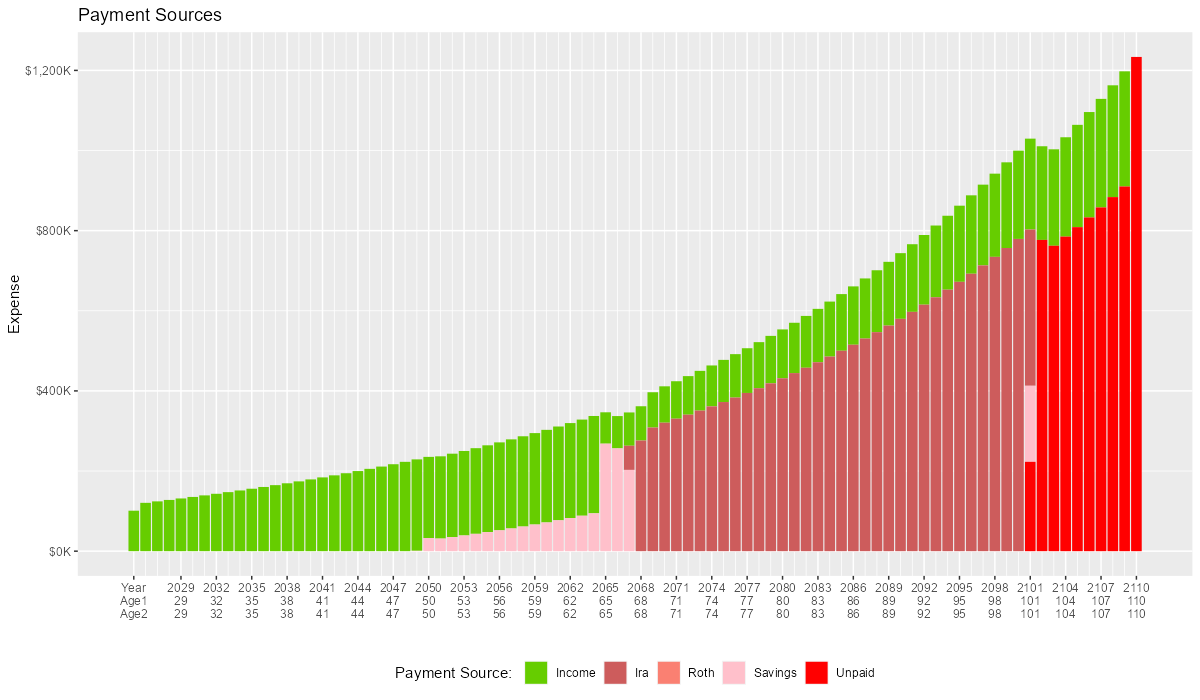
This graph also deals with expenses, but shows how the expenses are paid. Note the pink bit starting 2050 showing the couple using savings for expenses well before retirement. This is what happens when salary doesn't keep up with inflation!
2.1.2. MC
The graphs in this section are what you get from retire.R when the simulation has monte carlo.
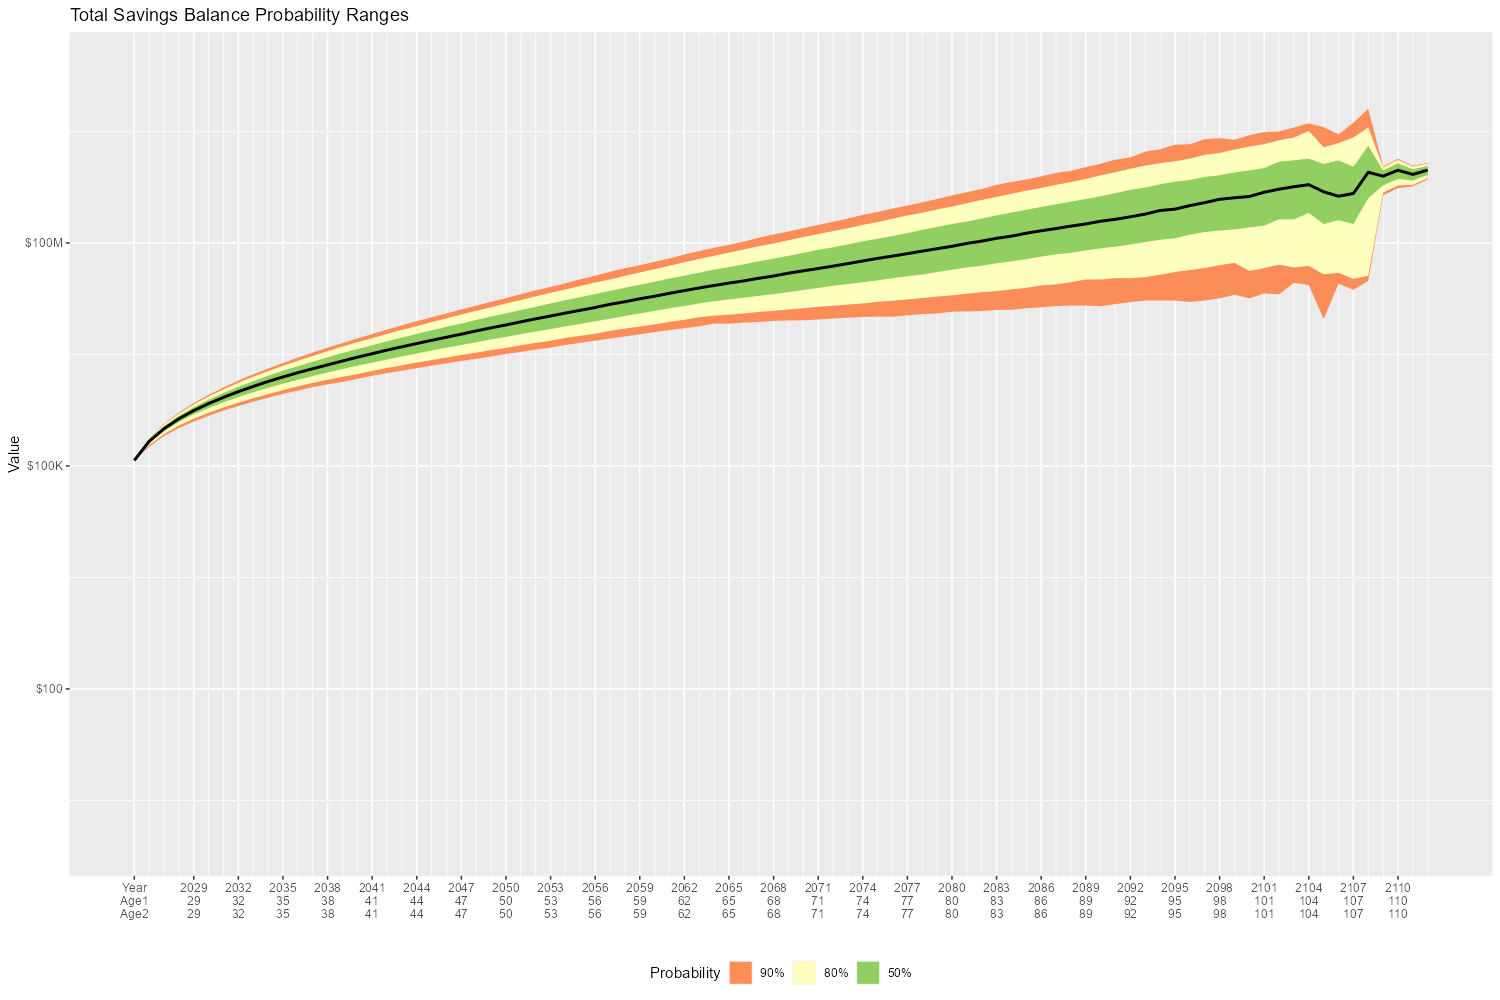
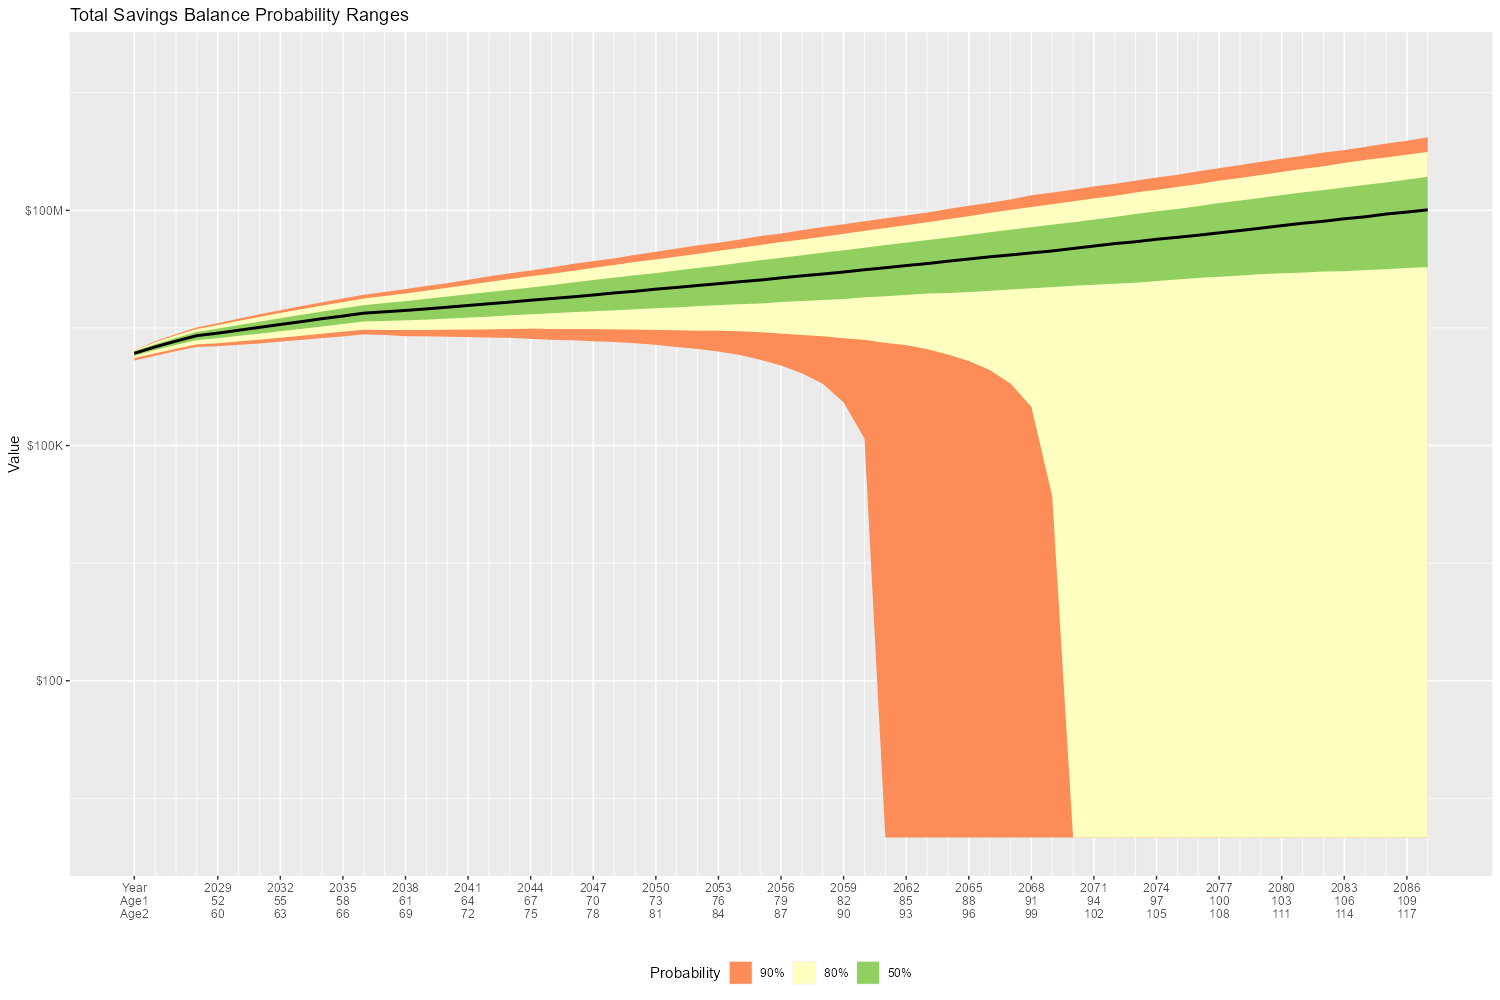
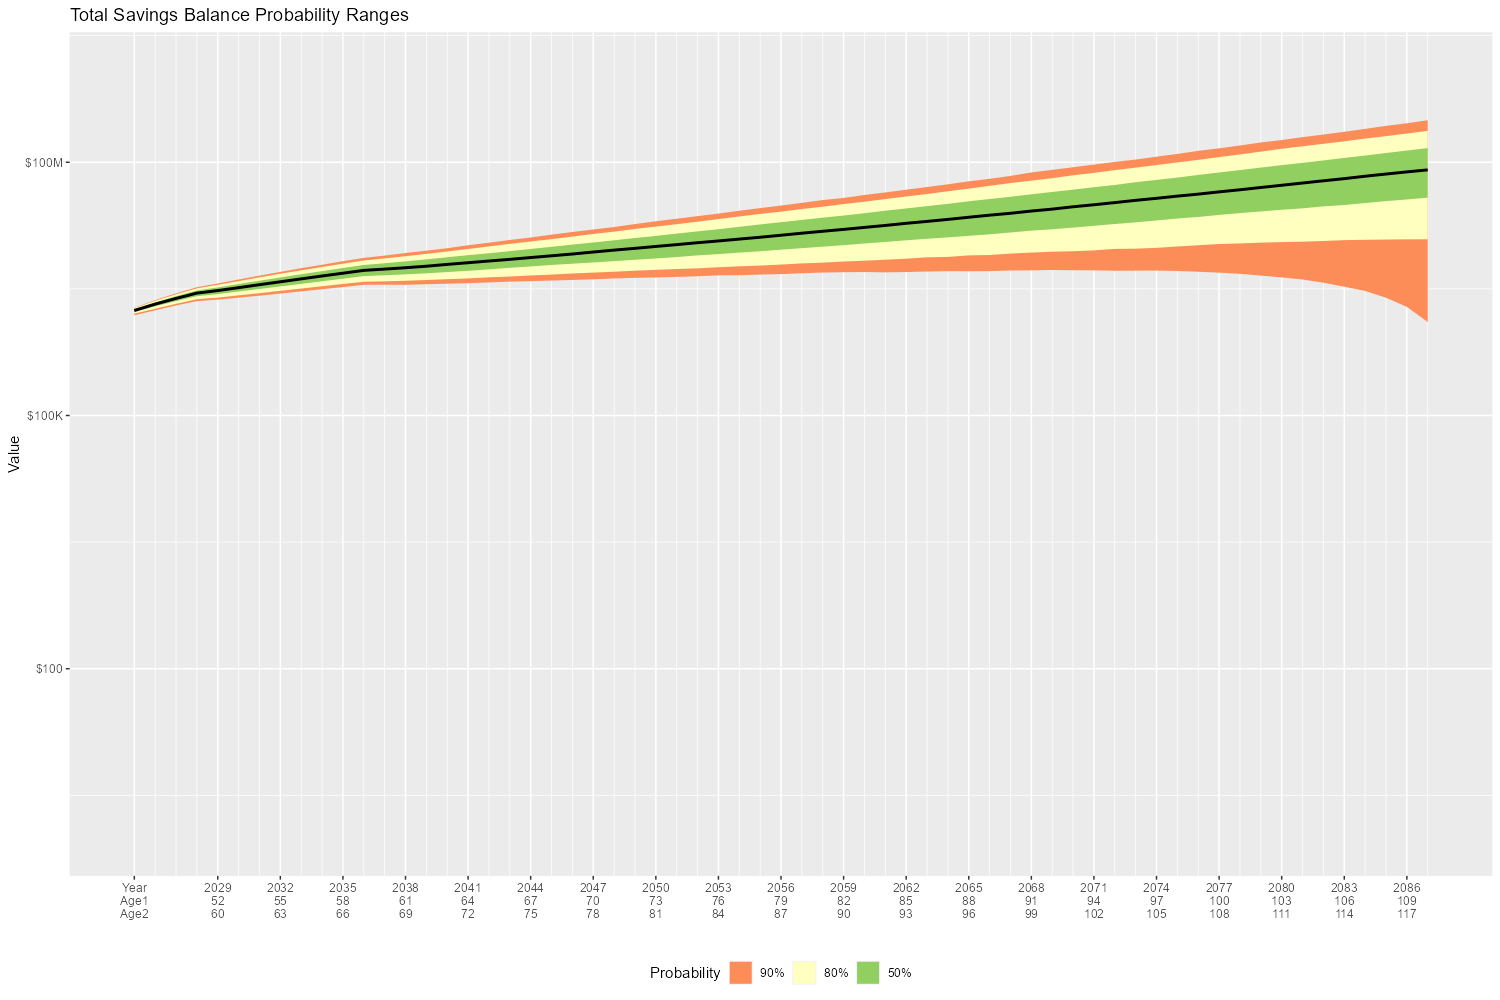
This first graph shows the probability the savings balance trajectory will be within the color band. For example the inner green band contains 50% of all
simulation runs. The yellow band, which includes the green band, contains 80% of all simulation runs. You can change the number and bounds for the bands in
the retire.R script.
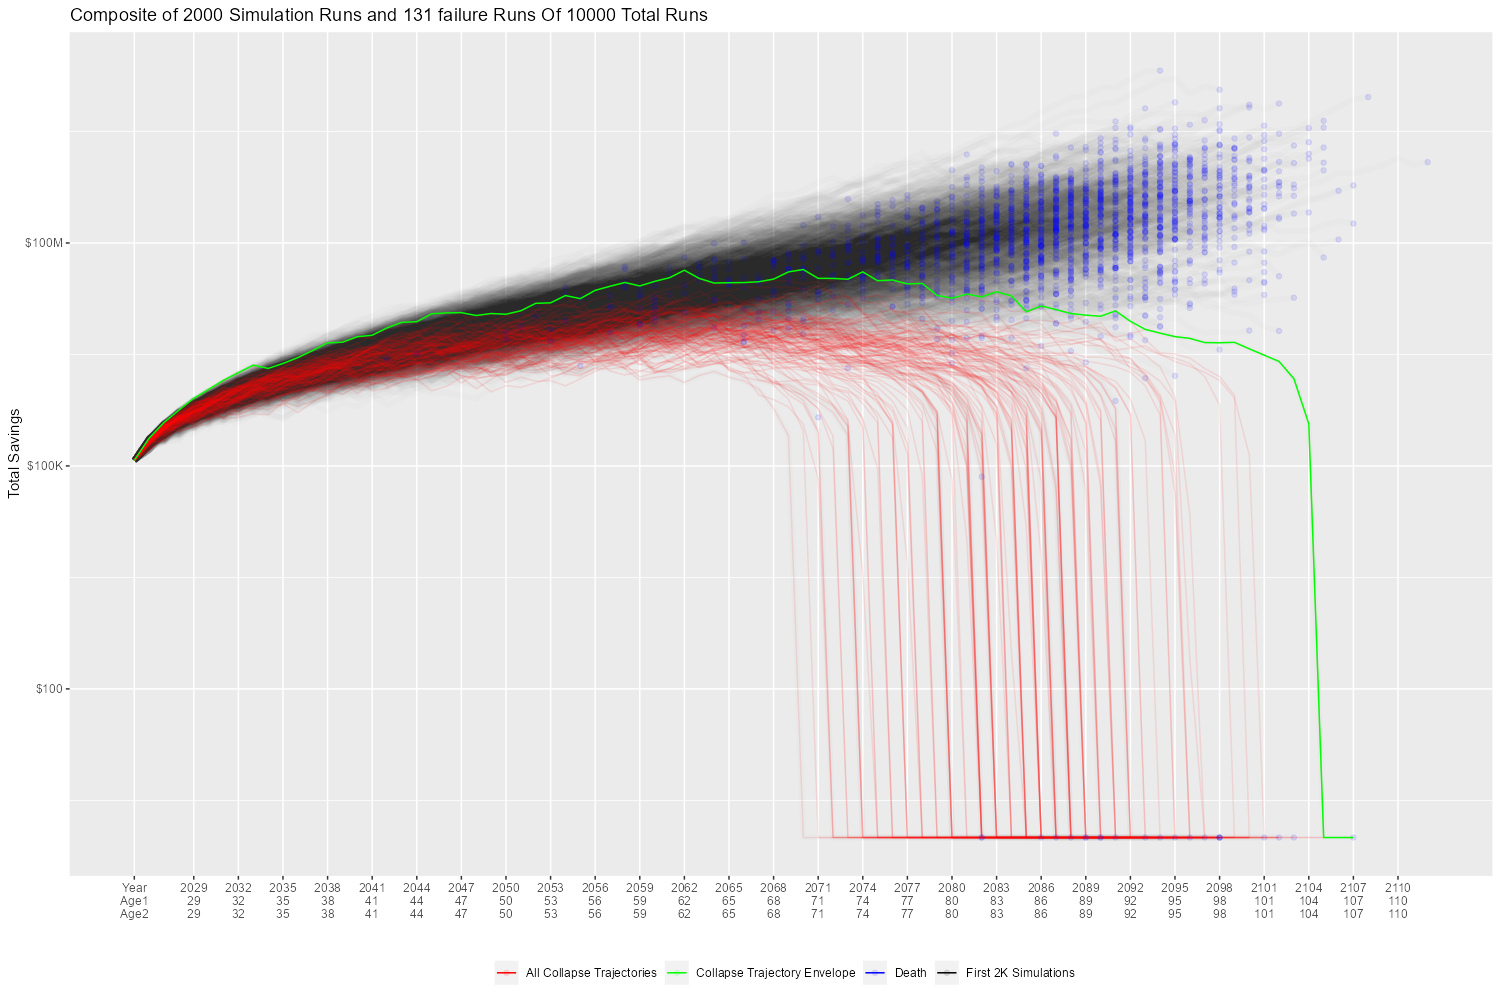
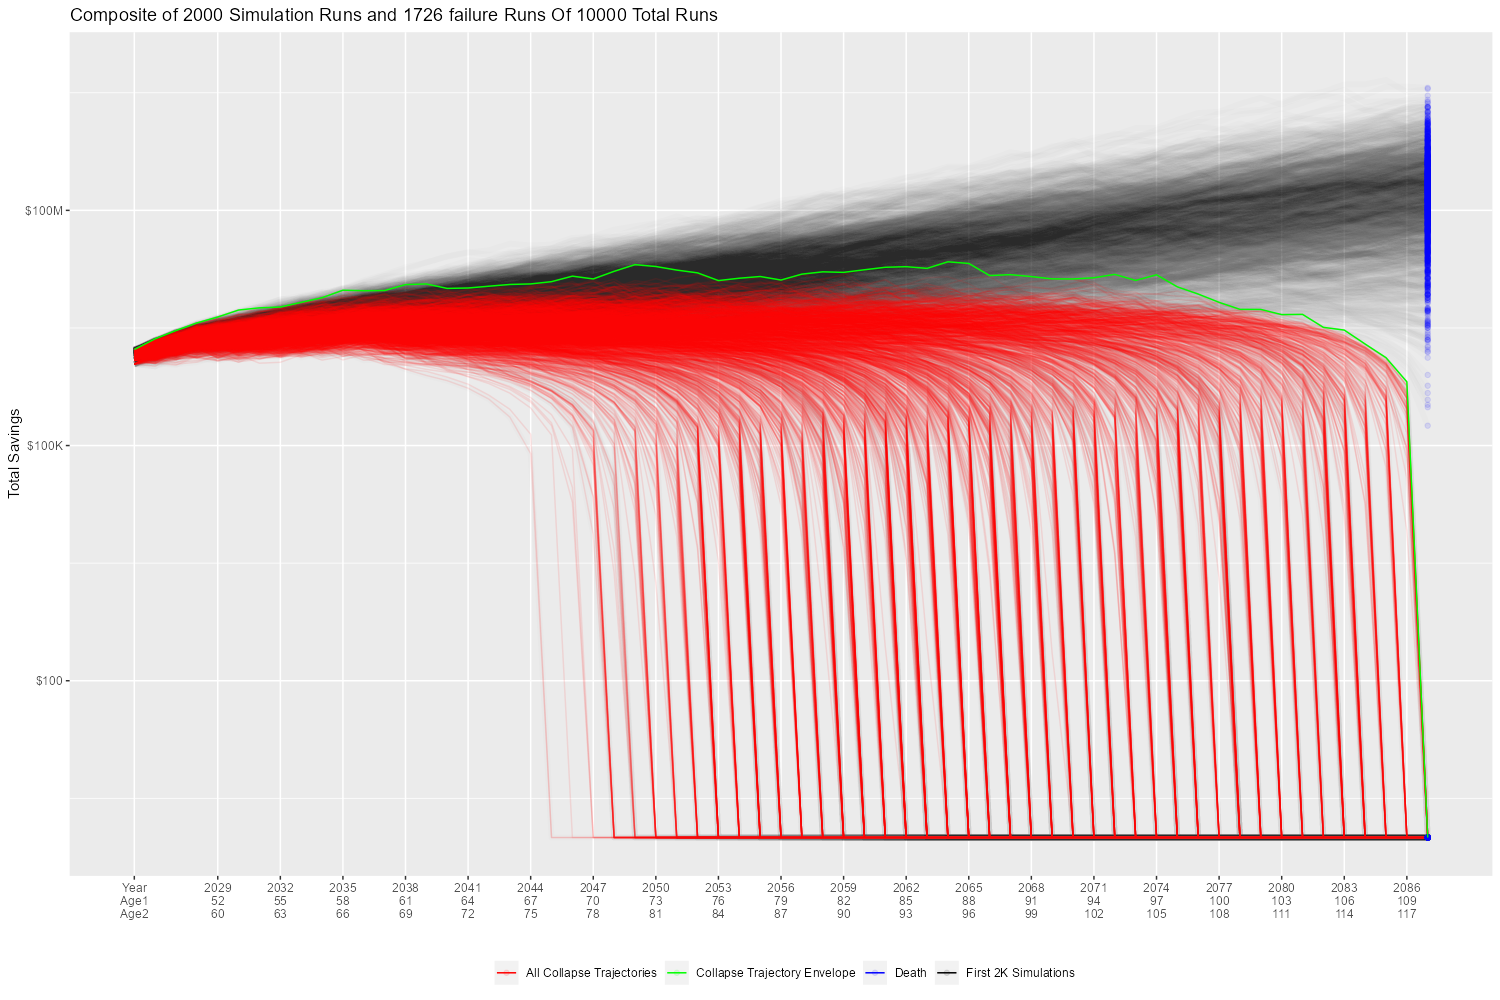
This graph shows 2000 savings trajectories, all the failure trajectories (when we went broke), and an envelope for the highest balance for trajectories that failed. In essence the green line shows a "safe" balance at which we are unlikely to see failure. The little blue dots show the ends of trajectories where both people have died.
This graph is similar to the probability band graph, but is a more traditional presentation for people accustomed to box plots.
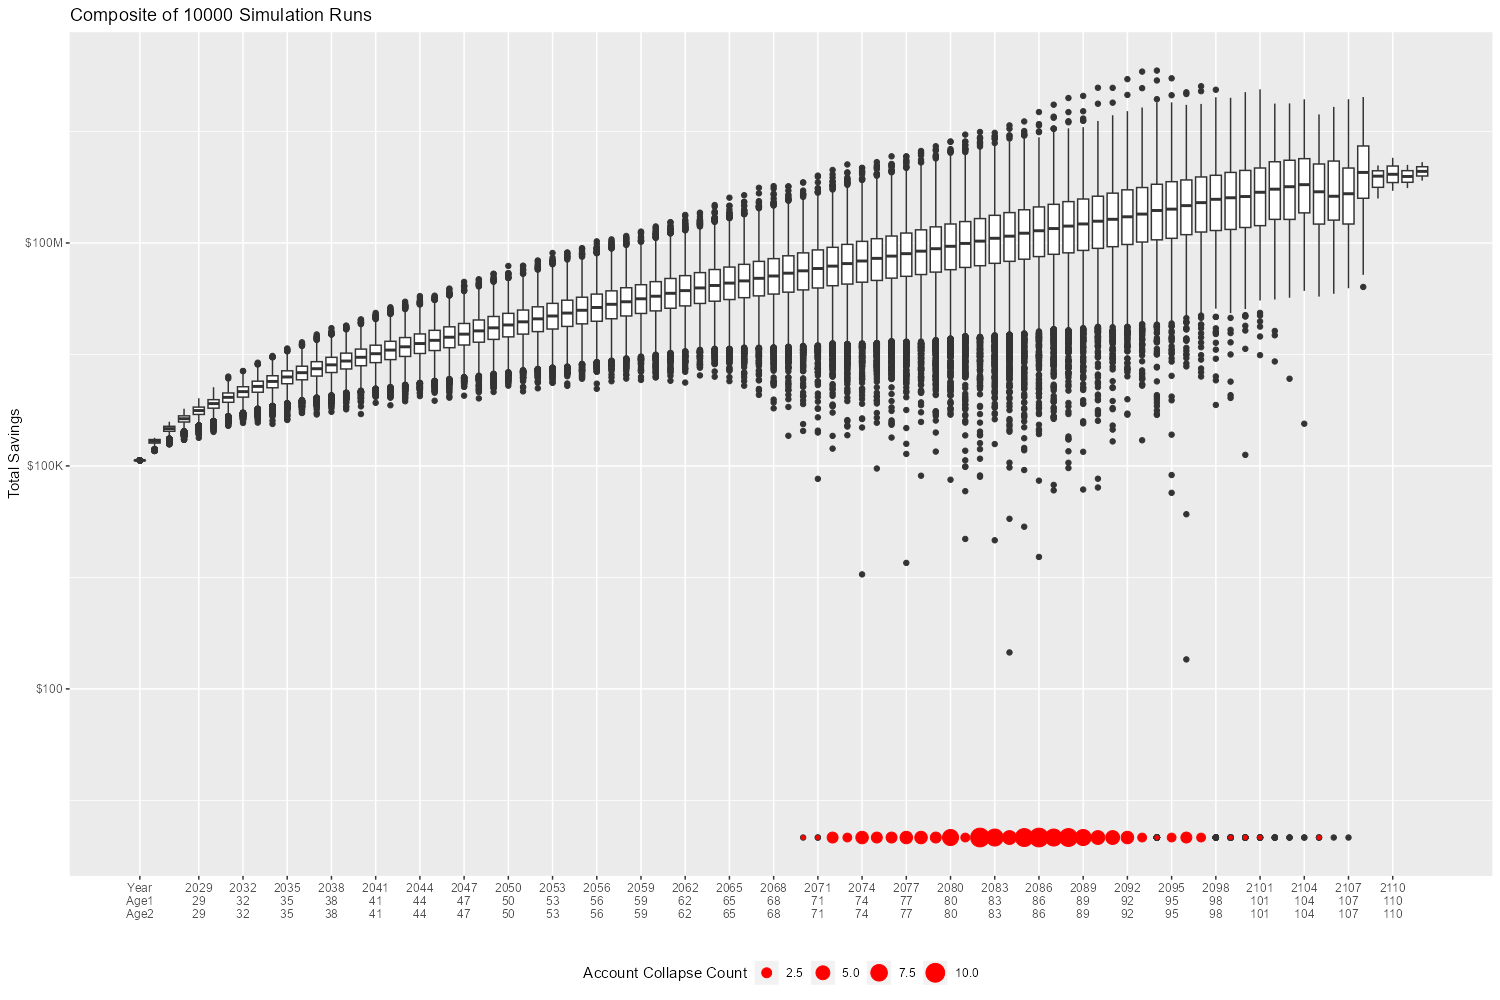
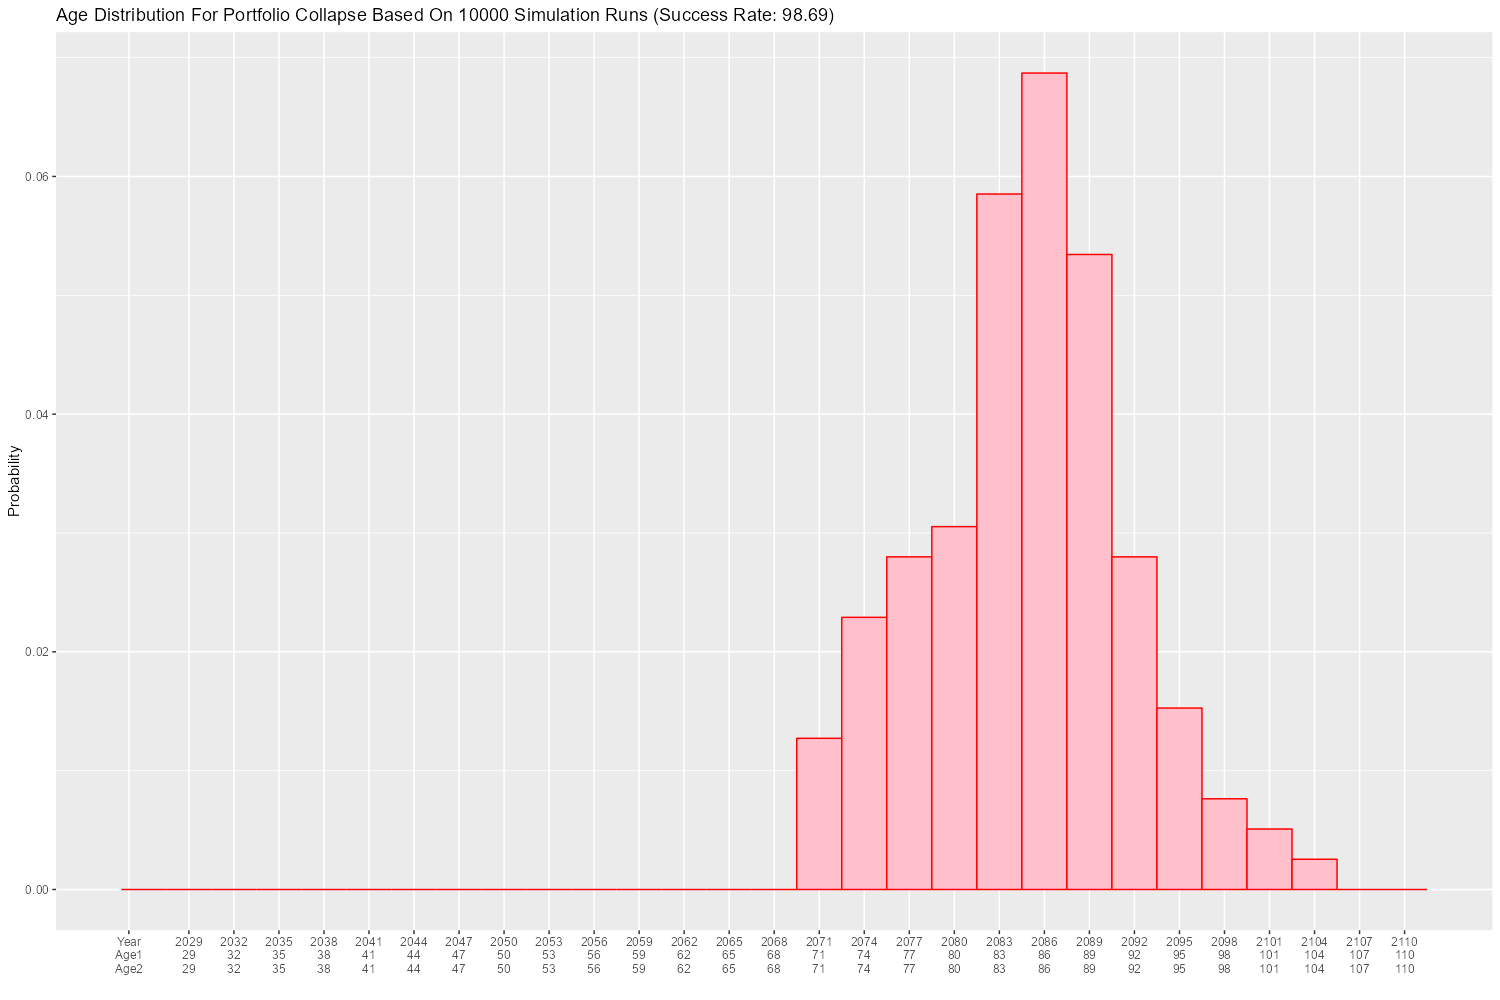
This graph shows us the ages at which simulations went broke, and how frequently it occurred for each age group. Each bar spans three years.
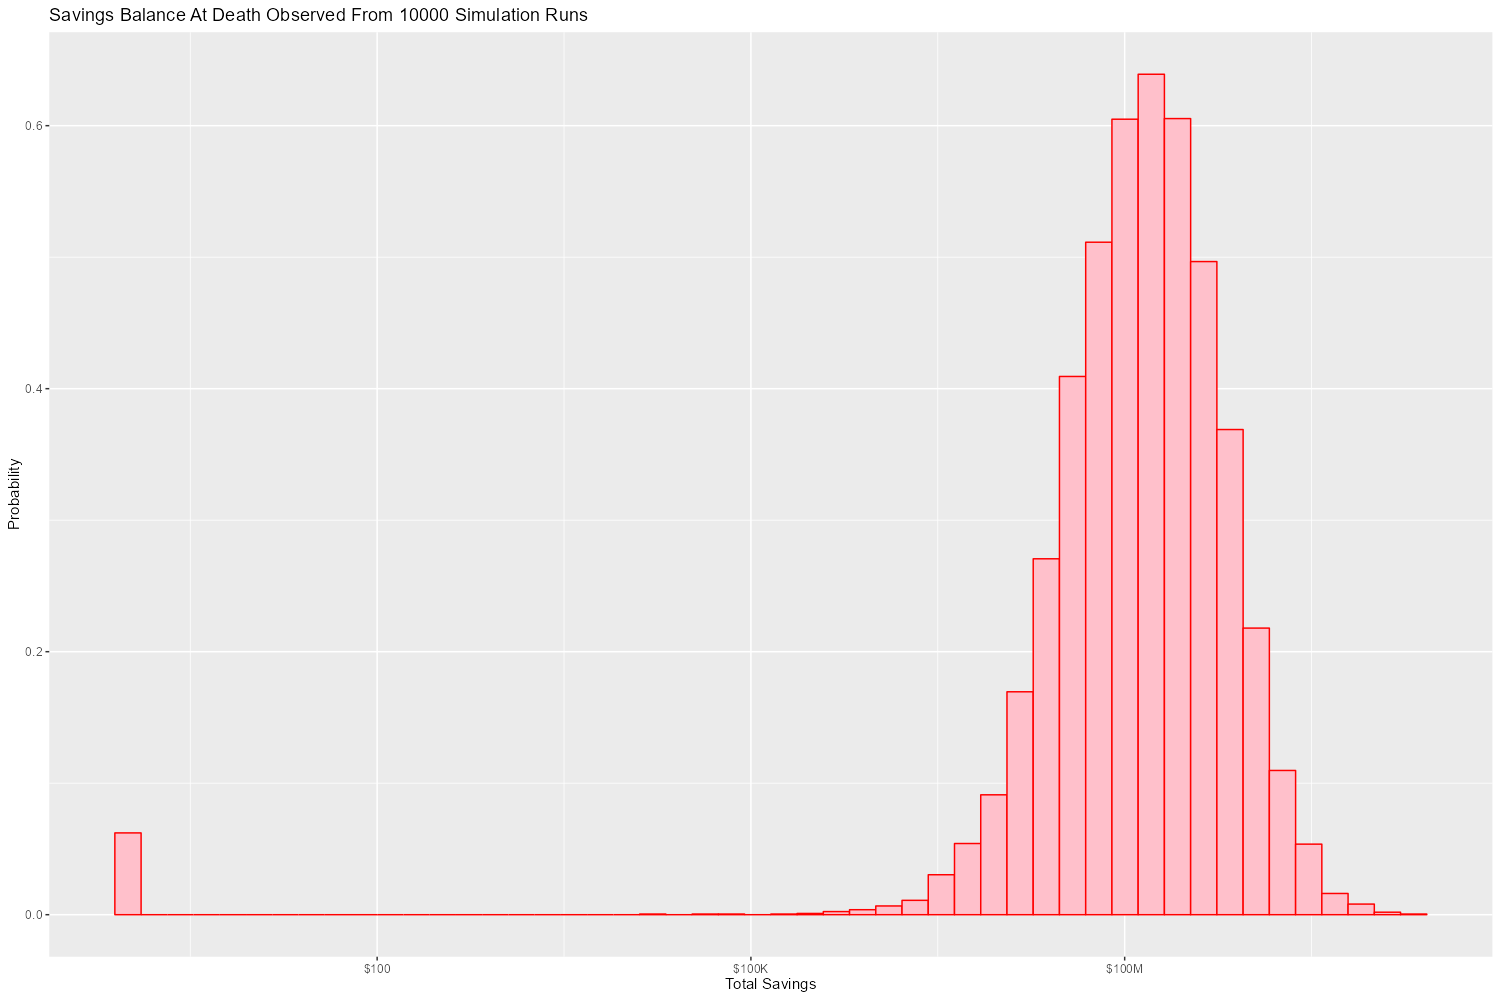
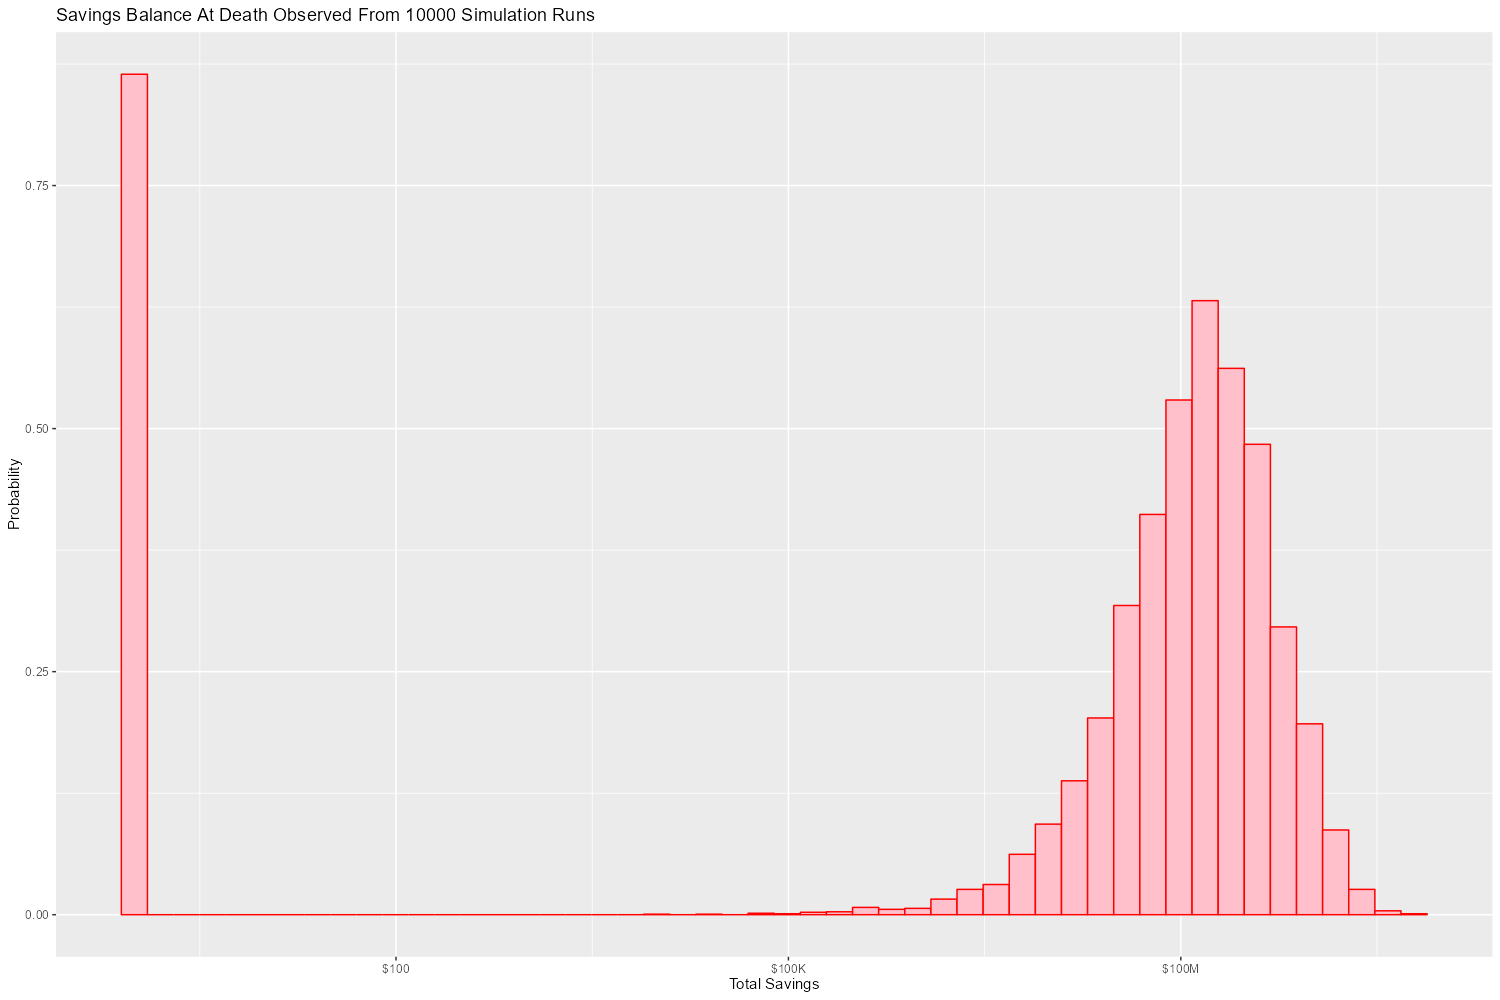
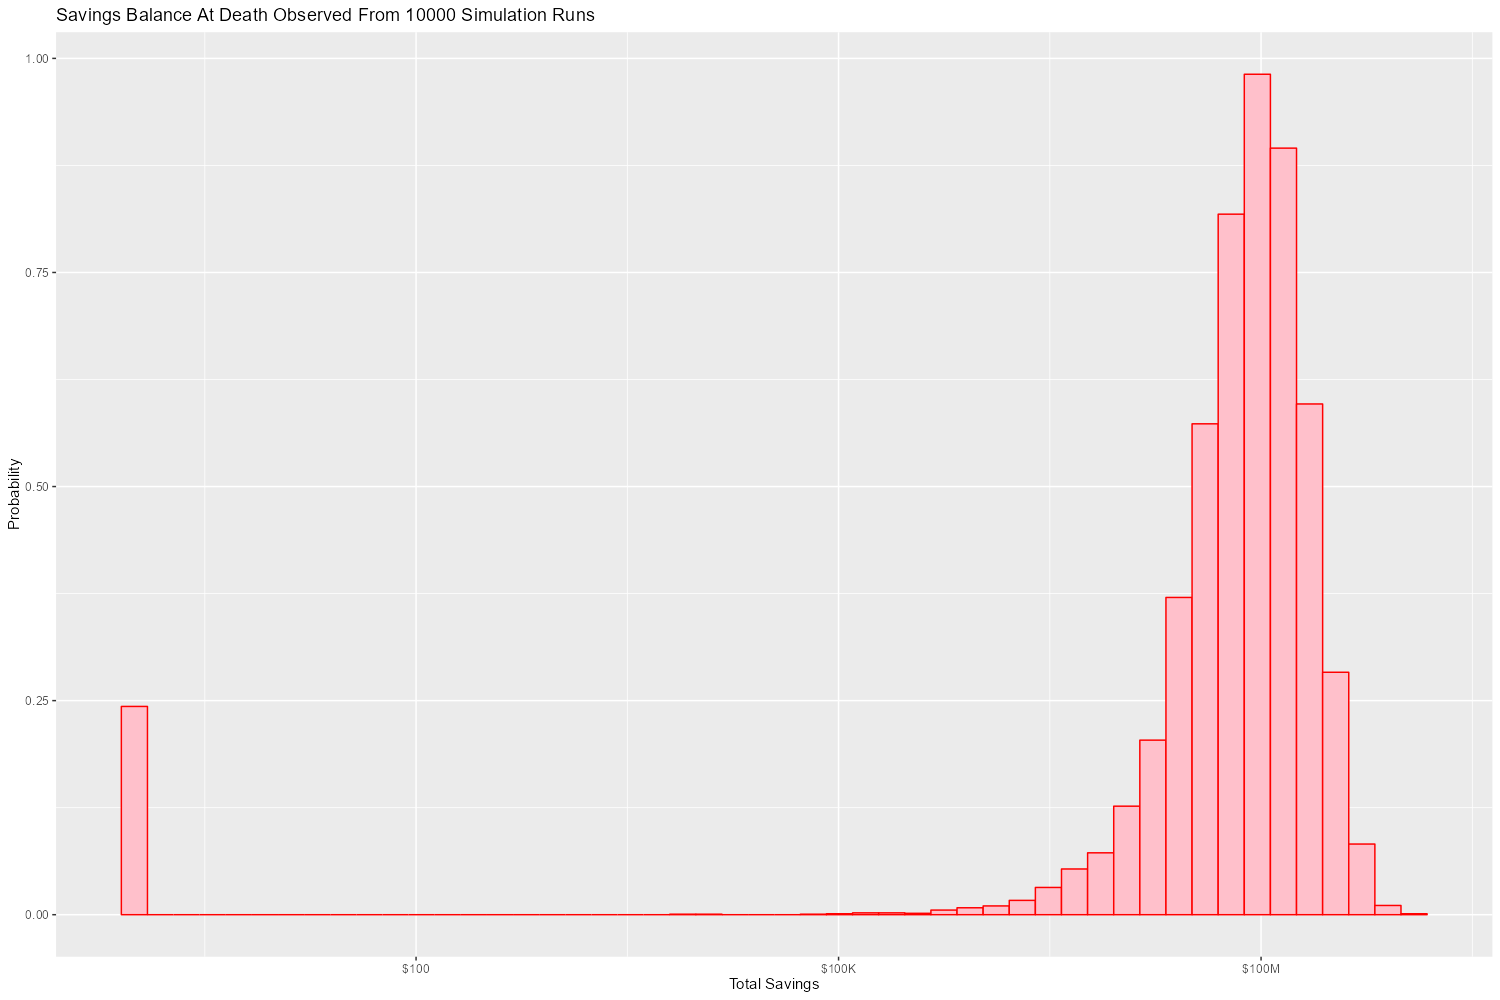
Lastly we have a graph that shows us the probability distribution of final savings balance at the end of the simulation.
2.1.3. Config File
You can find this file in the GIT repository here: config_20.nml
&SIMPARM
monte_carlo_years                   = 40,        !! Years of reference data to use
monte_carlo_runs                    = 10000,     !! Number of sims

initial_brokerage_balance           = 0.0,       !! Sum of all normally taxable accounts
initial_ira_balance_p1              = 0.0,       !! Sum of all tax deferred accounts for p1
initial_ira_balance_p2              = 0.0,       !! Sum of all tax deferred accounts for p2
initial_roth_balance_p2             = 0.0,       !! Sum of all roth-like tax deferred accounts for p2
initial_roth_balance_p1             = 0.0,       !! Sum of all roth-like tax deferred accounts for p1

high_investment_p                   = 100.0,     !! percentage of investments at high growth
mid_investment_p                    = 0.0,       !! percentage of investments at medium growth
low_investment_p                    = 0.0,       !! percentage of investments at low growth

high_investment_apr                 = 4.0,       !! apr for investments at high growth
                                                 !! Used for retirement accounts and the brokerage!
                                                 !! If negative, then do monte carlo with snp_dat
mid_investment_apr                  = 0.0,       !! apr for investments at medium growth
                                                 !! Used for retirement accounts and the brokerage!
                                                 !! If negative, then set to high_investment_apr/2
low_investment_apr                  = 0.0,       !! apr for investments at low growth
                                                 !! Used for retirement accounts and the brokerage.
                                                 !! If negative, then do monte carlo with dgs10_dat
cash_position_growth                = 2.5,       !! par for cash position in investment accounts
                                                 !! Used for retirement accounts and the brokerage.

initial_cash_reserves               = 10000.0,   !! Sum of all cash reserves
cash_reserves_growth                = 0.01,      !! Growth for cash reserves account

initial_emergency_fund              = 10000.0,   !! Near zero risk investments
emergency_fund_growth               = 3.0,       !! Rate at which the emergency account grows
                                                 !! If negative, then set to low_investment_apr

first_year_tax                      = 1000.0,    !! Taxes to pay the first year of the simulation

worst_case_inflation_rate           = -5.0,      !! Used for investment cut-off decisions
                                                 !! If negative, don't use a cuff-off
fixed_inflation_rate                = 3.0,       !! Inflation impacts annual expenses
                                                 !! If negative, then do monte carlo

initial_expected_expenses_shr       = 100000.0,  !! Shared first year expenses.
initial_expected_expenses_p1        = 0,         !! First year expenses for p1.
initial_expected_expenses_p2        = 0,         !! First year expenses for p2.

social_security_start_age_p1        = 65,        !! First year we get SS for p1
social_security_start_age_p2        = 65,        !! First year we get SS for p2
initial_social_security_monthly_p1  = 1000.0,    !! Just a guess.  Probably low.
initial_social_security_monthly_p2  = 1000.0,    !! Just a guess.  Probably low.
social_security_growth              = -1.0,      !! Usually matches inflation
                                                 !! If negative, then set to inflation

initial_gross_work_salary_p1        = 100000.0,  !! Taxable part of p1's salary
initial_gross_work_salary_p2        = 100000.0,  !! Taxable part of p2's salary
work_salary_growth                  = 2.0,       !! Hard to estimate
                                                 !! If negative, then set to max(0, inflation/2)

initial_annual_ira_contrib_base     = 23000.0,   !! Starting base contribution
initial_annual_ira_contrib_catchup  = 7000.0,    !! Starting catchup contribution
annual_ira_contrib_growth           = -3.0,      !! Grow 401k contribution (inflation?)
                                                 !! If negative, then set to inflation

initial_annual_roth_contrib_base    = 0.0,       !! Starting base contribution
initial_annual_roth_contrib_catchup = 0.0,       !! Starting catchup contribution
annual_roth_contrib_growth          = 0.0,       !! Grow 401k contribution
                                                 !! If negative, then set to inflation

target_taxable_income               = 0,         !! Target tax for roth conversion
minimum_roth_conversion             = 0,         !! Minimum size of roth conversion
maximum_roth_conversion_year        = 0,         !! No conversions after this year

surplus_reinvest                    = 100.0,     !! Percentage of ExtraNS to reinvest

retirement_year_p1                  = 2065,      !! First year p1 is fully retired
retirement_year_p2                  = 2065,      !! First year p2 is fully retired
birthday_p1                         = 2000,      !!
birthday_p2                         = 2000,      !!
sex_p1                              = 'M',       !! Sex of p1 -- selects SSI life table
sex_p2                              = 'F',       !! Sex of p2 -- selects SSI life table
life_expectancy_p1                  = 110,       !! Age p1 expects to die
                                                 !! If zero then compute based on age & sex
                                                 !! If negative then use monte carlo
life_expectancy_p2                  = 110,       !! Age p2 expects to die
                                                 !! If zero then compute based on age & sex
                                                 !! If negative then use monte carlo

verbosity                           = 10         !! How much to print when running
                                                 !!  -  0 : nothing
                                                 !!  - 10 : progress
                                                 !!  - 20 : variables
                                                 !!  - 30 : more variables
/
If you have make configured as described here, then you can create all the images
in this section by entering the retirement_simulation/ directory, and running make like this:
make 20
2.2. Approaching Retirement
Here we have a couple (47 & 55 years old). Each have 500k in a 401k. They plan on putting it all in the S&P, and 20% in low risk 5% funds. They also have 100k balances in both an emergency fund and checking account. The checking account earns 0.01% interest, and the emergency fund is in CDs earning 2.9%. They are both employed, and are have aggressively saving at the maximum rate into a 401k. They spend 110K per year on expenses. They believe inflation will be about 3%. They both wish to stop working when they are 60. The younger person will start taking SS at 63 while the older one will start at age 70.
2.2.1. A Risky Plan
In my opinion, this plan is too aggressive. I know the S&P 500 has an average return of 10% over the last couple decades, but depending on a 7% return is just too risky. This is especially true with only 1M in total savings.
Things look just fine if we consider a simulation using ideal, fixed growth and inflation. Here is what the overall savings balance looks:

If we take a look at the savings probability bands, we see a very different picture:
And if we look at a few paths and the account collapse cases, things look pretty scary:
Another way to look at this is the distribution of final savings. That huge bar on the left tells us that running out of money is the single most probable outcome from this plan.
2.2.2. An Alternate Plan
They can dramatically improve the chances of success by saving more (bumping up total savings by 250k), and spending less (drop annual expenses by 1k).
The new savings probability bands are much more positive:
And the overall path picture is much more positive:
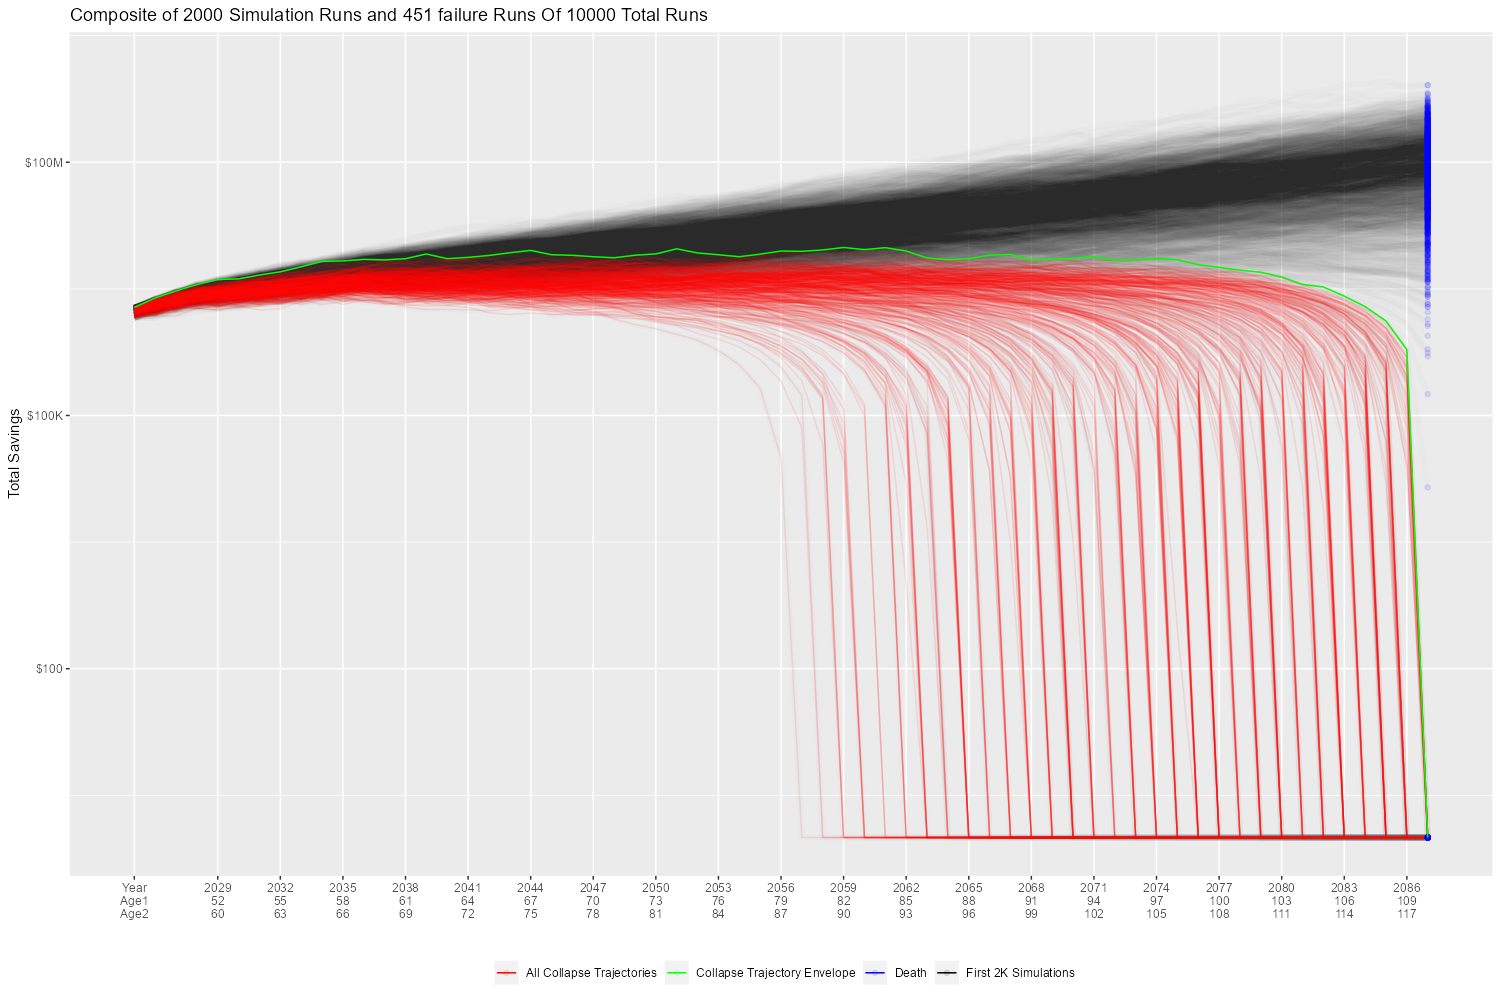
Lastly, the distribution of final savings no longer shows dying broke as the highest probability outcome.
2.2.3. Config Files
You can find the configuration file in the GIT repository here: config_60.nml
The configuration file for the origional plan:
&SIMPARM
monte_carlo_years                   = 40,        !! Years of reference data to use
monte_carlo_runs                    = 10000,     !! Number of sims

initial_brokerage_balance           = 0.0,       !! Sum of all normally taxable accounts
initial_ira_balance_p1              = 500000.0,  !! Sum of all tax deferred accounts for p1
initial_ira_balance_p2              = 500000.0,  !! Sum of all tax deferred accounts for p2
initial_roth_balance_p2             = 0.0,       !! Sum of all roth-like tax deferred accounts for p2
initial_roth_balance_p1             = 0.0,       !! Sum of all roth-like tax deferred accounts for p1

high_investment_p                   = 80.0,      !! percentage of investments at high growth
mid_investment_p                    = 00.0,      !! percentage of investments at medium growth
low_investment_p                    = 20.0,      !! percentage of investments at low growth

high_investment_apr                 = 7.0,       !! apr for investments at high growth
                                                 !! Used for retirement accounts and the brokerage!
                                                 !! If negative, then do monte carlo with snp_dat
mid_investment_apr                  = 0.0,       !! apr for investments at medium growth
                                                 !! Used for retirement accounts and the brokerage!
                                                 !! If negative, then set to high_investment_apr/2
low_investment_apr                  = 5.0,       !! apr for investments at low growth
                                                 !! Used for retirement accounts and the brokerage.
                                                 !! If negative, then do monte carlo with dgs10_dat
cash_position_growth                = 2.5,       !! par for cash position in investment accounts
                                                 !! Used for retirement accounts and the brokerage.

initial_cash_reserves               = 100000.0,  !! Sum of all cash reserves
cash_reserves_growth                = 0.01,      !! Growth for cash reserves account

initial_emergency_fund              = 100000.0,  !! Near zero risk investments
emergency_fund_growth               = 2.9,       !! Rate at which the emergency account grows
                                                 !! If negative, then set to low_investment_apr

first_year_tax                      = 50000.0,   !! Taxes to pay the first year of the simulation

worst_case_inflation_rate           = -5.0,      !! Used for investment cut-off decisions
                                                 !! If negative, don't use a cuff-off
fixed_inflation_rate                = 3.0,       !! Inflation impacts annual expenses
                                                 !! If negative, then do monte carlo

initial_expected_expenses_shr       = 110000.0,  !! First year expenses.
initial_expected_expenses_p1        = 0,         !! First year expenses for p1.
initial_expected_expenses_p2        = 0,         !! First year expenses for p2.

social_security_start_age_p1        = 63,        !! First year we get SS for p1
social_security_start_age_p2        = 70,        !! First year we get SS for p2
initial_social_security_monthly_p1  = 1000.0,    !! Just a guess.  Probably low.
initial_social_security_monthly_p2  = 1000.0,    !! Just a guess.  Probably low.
social_security_growth              = -1.0,      !! Usually matches inflation
                                                 !! If negative, then set to inflation

initial_gross_work_salary_p1        = 170000.0,  !! Taxable part of p1's salary
initial_gross_work_salary_p2        = 180000.0,  !! Taxable part of p2's salary
work_salary_growth                  = 2.0,       !! Hard to estimate
                                                 !! If negative, then set to max(0, inflation/2)

initial_annual_ira_contrib_base     = 23000.0,   !! Starting base contribution
initial_annual_ira_contrib_catchup  = 7000.0,    !! Starting catchup contribution
annual_ira_contrib_growth           = -1.0,      !! Grow 401k contribution (inflation?)
                                                 !! If negative, then set to inflation

initial_annual_roth_contrib_base    = 0.0,       !! Starting base contribution
initial_annual_roth_contrib_catchup = 0.0,       !! Starting catchup contribution
annual_roth_contrib_growth          = 0.0,       !! Grow 401k contribution
                                                 !! If negative, then set to inflation

target_taxable_income               = 0,         !! Target tax for roth conversion
minimum_roth_conversion             = 0,         !! Minimum size of roth conversion
maximum_roth_conversion_year        = 0,         !! No conversions after this year

surplus_reinvest                    = 100.0,     !! Percentage of ExtraNS to reinvest

retirement_year_p1                  = 2037,      !! First year p1 is fully retired
retirement_year_p2                  = 2029,      !! First year p2 is fully retired
birthday_p1                         = 1977,      !!
birthday_p2                         = 1969,      !!
sex_p1                              = 'M',       !! Sex of p1 -- selects SSI life table
sex_p2                              = 'F',       !! Sex of p2 -- selects SSI life table
life_expectancy_p1                  = 110,       !! Age p1 expects to die
                                                 !! If zero then compute based on age & sex
                                                 !! If negative then use monte carlo
life_expectancy_p2                  = 110,       !! Age p2 expects to die
                                                 !! If zero then compute based on age & sex
                                                 !! If negative then use monte carlo

verbosity                           = 10         !! How much to print when running
                                                 !!  -  0 : nothing
                                                 !!  - 10 : progress
                                                 !!  - 20 : variables
                                                 !!  - 30 : more variables
/
The updated plan changes these lines
initial_ira_balance_p1              = 625000.0,  !! Sum of all tax deferred accounts for p1
initial_ira_balance_p2              = 625000.0,  !! Sum of all tax deferred accounts for p2
high_investment_p                   = 50.0,      !! percentage of investments at high growth
low_investment_p                    = 20.0,      !! percentage of investments at low growth
initial_expected_expenses_shr       = 100000.0,  !! First year expenses.
If you have make configured as described here, then you can create all the images
in this section by entering the retirement_simulation/ directory, and running make like this:
make 60o
make 60ml
3. Operation
The simulator may be found in the FortranFinance package under the sub-directory retirement_simulation. This
document forms the primary documentation, and its permanent home is here.
3.1. Environment
The simulator is designed to run in a command line environment (MSYS2 on Windows, UNIX, Linux, Linux on WSL, MacOS X). I expect that you already have a
Fortran development environment, git, and
GNU Make installed. In order to run the visualizations, you will need
R and the following CRAN packages installed: knitr, jsonlite, quantmod, gridExtra, data.table,
dplyr, tidyr, ggplot2, scales, RColorBrewer.
3.2. Download
The easiest way to download everything is to clone with git:
git clone 'https://github.com/richmit/FortranFinance.git'
3.3. Software Build
The simulator is in the retirement_simulation directory. That directory contains a makefile that will build the application. You may need
to edit that makefile for your system configuration – follow the instructions here. Once you have the
makefile working, you can build with the following command:
make retire
This will result in a executable (named "retire" on most UNIX-like platforms, and "retire.exe" on Windows).
3.4. Running The Simulator
The retire command takes the name of the the configuration describing the simulation parameters as an optional argument. If it is missing, then the name
is assumed to be "retire.nml". This document contains a couple example configuration files: config_20.nml and
config_60.nml.
When run, the retire command will place its results in a file called "retire.out". This output file is a simple text file that you could load into Excel
to analyze. I use an R script for the analysis called "retire.R". If you run this script, you will
get lots of graphics (see the Examples section below). In summary, you might do the following:
./retire.exe my_config.nml
R -q -f retire.R