Data Smoothing
| Author: | Mitch Richling |
| Updated: | 2022-06-04 16:17:47 |
Copyright 2020-2021 Mitch Richling. All rights reserved.
Table of Contents
1. Metadata
The home for this HTML file is: https://richmit.github.io/ex-R/smoothing.html
Files related to this document may be found on github: https://github.com/richmit/ex-R
Directory contents:
src |
- | The org-mode file that generated this HTML document |
docs |
- | This html document |
data |
- | Data files |
tangled |
- | Tangled R code from this document |
2. Example Data
nPts <- 150
xDat <- 1:nPts
yDat <- rnorm(nPts, mean=0, sd=10)+xDat*.2
3. Various Smoothers
3.1. Compute various smoothed data sets
Some methods produce objects with new X data while others just produce new Y data.
smDatRunMed     <- runmed(yDat, 15)                      # Running Median
smDatRunAvg2    <- stats::filter(yDat,                   # Two sided, running average
                                 rep(1/15,15),
                                 method='convolution',
                                 sides=2)
smDatRunAvg1    <- stats::filter(yDat,                   # One sided, running average
                                 rep(1/7,7),
                                 method='convolution',
                                 sides=1)
smDatTuk3RS3R   <- smooth(yDat, kind = "3RS3R")          # Tukey Smoother
smDatLowess0d10 <- lowess(xDat, yDat, f=.1)              # Cleveland lowess smoother
smDatSupSmu     <- supsmu(xDat, yDat, span=.1)           # Friedman's SuperSmoother
3.2. Put it all in a data.frame for ggplot
allDat <- rbind(data.frame(smoother=rep('actual',   nPts), x=xDat,           y=yDat),
                data.frame(smoother=rep('runMed',   nPts), x=xDat,           y=smDatRunMed),
                data.frame(smoother=rep('runAvg2',  nPts), x=xDat,           y=smDatRunAvg2),
                data.frame(smoother=rep('runAvg1',  nPts), x=xDat,           y=smDatRunAvg1),
                data.frame(smoother=rep('tuk3RS3R', nPts), x=xDat,           y=as.vector(smDatTuk3RS3R)),
                data.frame(smoother=rep('lowess',   nPts), x=smDatLowess0d10$x, y=smDatLowess0d10$y),
                data.frame(smoother=rep('supsmu',   nPts), x=smDatSupSmu$x,     y=smDatSupSmu$y)
                )
3.3. Plot them all
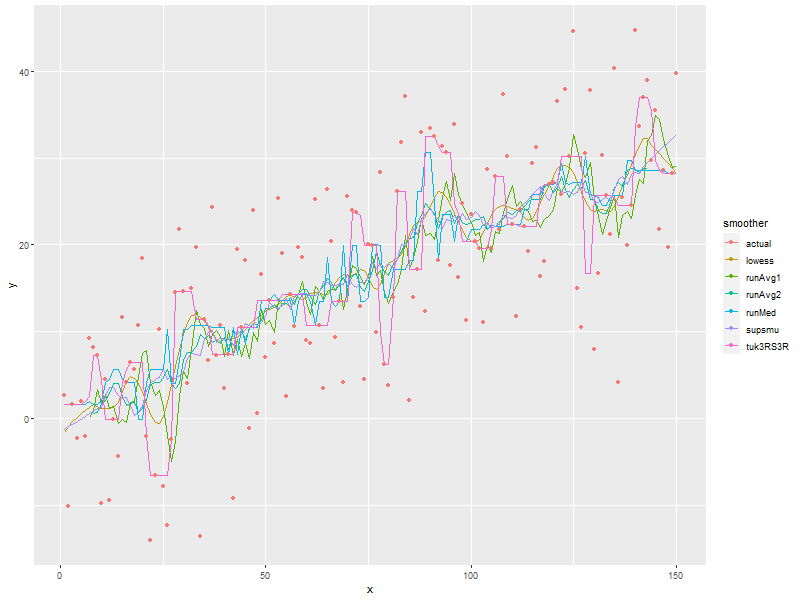
ggplot(allDat, aes(x=x, y=y, col=smoother)) +
  geom_line(data=subset(allDat,  smoother!='actual')) +
  geom_point(data=subset(allDat, smoother=='actual'))

4. Lowess f values
4.1. Compute three lowess smoothings with different f values
smDatLowess0d05   <- lowess(xDat, yDat, f=.05)
smDatLowess0d20   <- lowess(xDat, yDat, f=.20)
smDatLowess0d50   <- lowess(xDat, yDat, f=.50)
4.2. Put all of our lowess curves into a data.frame with the original data so we can plot it all with ggplot
allDat <- rbind(data.frame(smoother=rep('actual',       nPts), x=xDat,           y=yDat),
                data.frame(smoother=rep('lowess0d05',   nPts), x=smDatLowess0d05$x, y=smDatLowess0d05$y),
                data.frame(smoother=rep('lowess0d10',   nPts), x=smDatLowess0d10$x, y=smDatLowess0d10$y),
                data.frame(smoother=rep('lowess0d20',   nPts), x=smDatLowess0d20$x, y=smDatLowess0d20$y),
                data.frame(smoother=rep('lowess0d50',   nPts), x=smDatLowess0d50$x, y=smDatLowess0d50$y)
                )
4.3. Plot them all
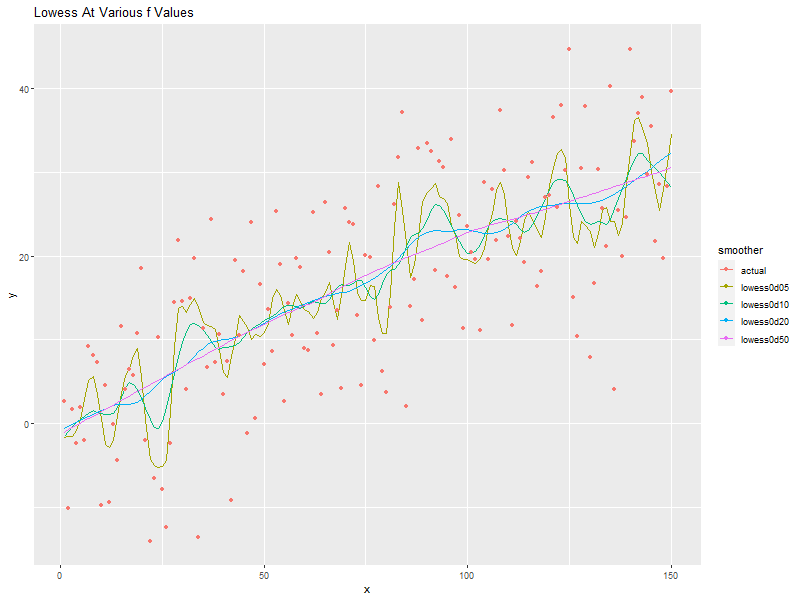
ggplot(allDat, aes(x=x, y=y, col=smoother)) +
  geom_line(data=subset(allDat,  smoother!='actual')) +
  geom_point(data=subset(allDat, smoother=='actual')) +
  labs(title='Lowess At Various f Values')
