T Tests
| Author: | Mitch Richling |
| Updated: | 2022-06-04 16:17:47 |
Copyright 2020-2021 Mitch Richling. All rights reserved.
Table of Contents
- 1. Metadata
- 2. Some Data
- 3. Welch Two Sample t-test
- 4. Two Sample t-test
- 5. Paired t-test
- 6. One Sample t-test (not equal)
- 7. One Sample t-test (greater than)
- 8. Wilcoxon signed rank test with continuity correction
- 9. Wilcoxon rank sum test with continuity correction
- 10. Wilcoxon signed rank test with continuity correction
1. Metadata
The home for this HTML file is: https://richmit.github.io/ex-R/tTests.html
Files related to this document may be found on github: https://github.com/richmit/ex-R
Directory contents:
src |
- | The org-mode file that generated this HTML document |
docs |
- | This html document |
data |
- | Data files |
tangled |
- | Tangled R code from this document |
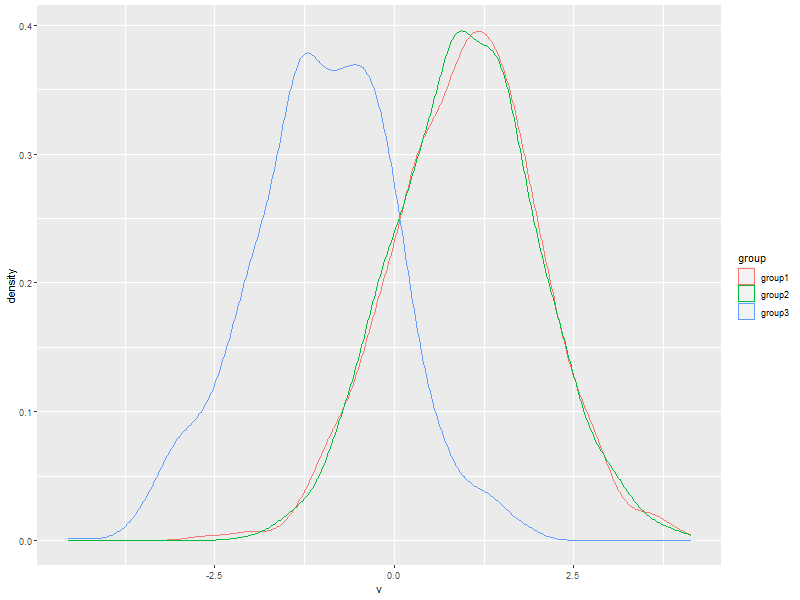
2. Some Data
popsz  <- 1000
mean1  <- 1
mean2  <- mean1
mean3  <- -1
group1 <- rnorm(popsz, mean=mean1)
group2 <- rnorm(popsz, mean=mean2)
group3 <- rnorm(popsz, mean=mean3)
allDat <- stack(list(group1=group1, group2=group2, group3=group3))
names(allDat) <- c('v', 'group')
ggplot(data=allDat, aes(x=v, col=group)) + geom_density()
3. Welch Two Sample t-test
Use when you don't know the variance of the two populations is equal
t.test(group1, group2)
    Welch Two Sample t-test

data:  group1 and group2
t = -0.022292, df = 1996.8, p-value = 0.9822
alternative hypothesis: true difference in means is not equal to 0
95 percent confidence interval:
 -0.08912823  0.08712479
sample estimates:
mean of x mean of y
 1.002692  1.003694
4. Two Sample t-test
Use when you DO know the variance of the two populations is equal
t.test(group1, group2, var.equal=TRUE)
    Two Sample t-test

data:  group1 and group2
t = -0.022292, df = 1998, p-value = 0.9822
alternative hypothesis: true difference in means is not equal to 0
95 percent confidence interval:
 -0.08912820  0.08712476
sample estimates:
mean of x mean of y
 1.002692  1.003694
5. Paired t-test
Use when the measurements in each group are related pairwise.
For example, the data could be temperature measurements taken with two thermometers each hour.
t.test(group1, group2, paired=TRUE)
    Paired t-test

data:  group1 and group2
t = -0.02259, df = 999, p-value = 0.982
alternative hypothesis: true difference in means is not equal to 0
95 percent confidence interval:
 -0.08801952  0.08601608
sample estimates:
mean of the differences
           -0.001001722
6. One Sample t-test (not equal)
Use when you want to know if the sample mean is equal to a hypothesized population mean
t.test(group1, mu=mean1)
t.test(group2, mu=mean2)
t.test(group3, mu=mean1)
    One Sample t-test

data:  group1
t = 0.083692, df = 999, p-value = 0.9333
alternative hypothesis: true mean is not equal to 1
95 percent confidence interval:
 0.939569 1.065815
sample estimates:
mean of x
 1.002692

    One Sample t-test

data:  group2
t = 0.11772, df = 999, p-value = 0.9063
alternative hypothesis: true mean is not equal to 1
95 percent confidence interval:
 0.9421213 1.0652664
sample estimates:
mean of x
 1.003694

    One Sample t-test

data:  group3
t = -61.969, df = 999, p-value < 2.2e-16
alternative hypothesis: true mean is not equal to 1
95 percent confidence interval:
 -1.058660 -0.932281
sample estimates:
 mean of x
-0.9954705
7. One Sample t-test (greater than)
Use when you want to know if the sample mean is less than a hypothesized population mean
t.test(group3, mu=mean1, alternative="greater")
    One Sample t-test

data:  group3
t = -61.969, df = 999, p-value = 1
alternative hypothesis: true mean is greater than 1
95 percent confidence interval:
 -1.048486       Inf
sample estimates:
 mean of x
-0.9954705
8. Wilcoxon signed rank test with continuity correction
Use when you want to know if the sample mean is equal to a hypothesized population mean
wilcox.test(group1, mu=mean1)
    Wilcoxon signed rank test with continuity correction

data:  group1
V = 253539, p-value = 0.7189
alternative hypothesis: true location is not equal to 1
9. Wilcoxon rank sum test with continuity correction
Use when the measurements in each group are related pairwise. This test is also known as the "independent 2-group Mann-Whitney U Test". T-test above.
wilcox.test(group1, group2)
    Wilcoxon rank sum test with continuity correction

data:  group1 and group2
W = 502591, p-value = 0.841
alternative hypothesis: true location shift is not equal to 0
10. Wilcoxon signed rank test with continuity correction
Use when the measurements in each group are related pairwise. See the paired T-test above.
wilcox.test(group1, group2, paired=TRUE)
    Wilcoxon signed rank test with continuity correction

data:  group1 and group2
V = 250276, p-value = 0.9978
alternative hypothesis: true location shift is not equal to 0