Excerpt From Lab Notebook
1. Introduction
If you are reading this in a web browser, then you are looking at an exported Emacs org-mode file. The original org-mode file is just a text
file loaded in my editor (Emacs). In the editor things are live. For example, if I click in one of the source code blocks below I can evaluate them
and get results pulled back into the document. In a real way, org-mode allows us to integrate different tools together into one worksheet-like workflow.
In this example we integrate code/results from mrSCPI, Octave/Matlab, Paraview, and Bourne shell in one document.
What we have below is actually an excerpt from one of my laboratory notebooks. The topic of the notebook in question was a sequence of experiments with a homemade analogue computer. In this excerpt, the analog computer is running a Lorenz program:

In order to demonstrate how data acquisition and analysis can be unified within Emacs with org-mode I have left out some of the "laboratory notebook"
stuff. In particular, the original notebook had a section with mrSCPI code to setup the power supply & oscilloscope. With this section missing it
makes some of the mrSCPI code seem incomplete – the way :WAVeform:POINts is hardwired to 100000 seems strange without seeing the preceding
:ACQuire:MDEPth call for example.
.. BEGIN Excerpt .. BEGIN Excerpt .. BEGIN Excerpt .. BEGIN Excerpt .. BEGIN Excerpt ..
2. mrSCPI: Acquire Data
:url @dho4k
:print_cmd false
:result_type nil
:cmd :STOP
:result_type nil
:cmd :WAVeform:MODE RAW
:cmd :WAVeform:FORMat WORD
:cmd :WAVeform:POINts 100000
:cmd :WAVeform:STARt 1
:cmd :WAVeform:SOURce CHANnel1
:result_type :string
:out_file ch1.pre
:cmd :WAVeform:PREamble?
:out_file ch1.dat
:cmd :WAVeform:DATA?
:result_type nil
:cmd :WAVeform:SOURce CHANnel2
:result_type :string
:out_file ch2.pre
:cmd :WAVeform:PREamble?
:out_file ch2.dat
:cmd :WAVeform:DATA?
:result_type nil
:cmd :WAVeform:SOURce CHANnel3
:result_type :string
:out_file ch3.pre
:cmd :WAVeform:PREamble?
:out_file ch3.dat
:cmd :WAVeform:DATA?
This will produce several files:
3. Octave/Matlab: The Waveforms
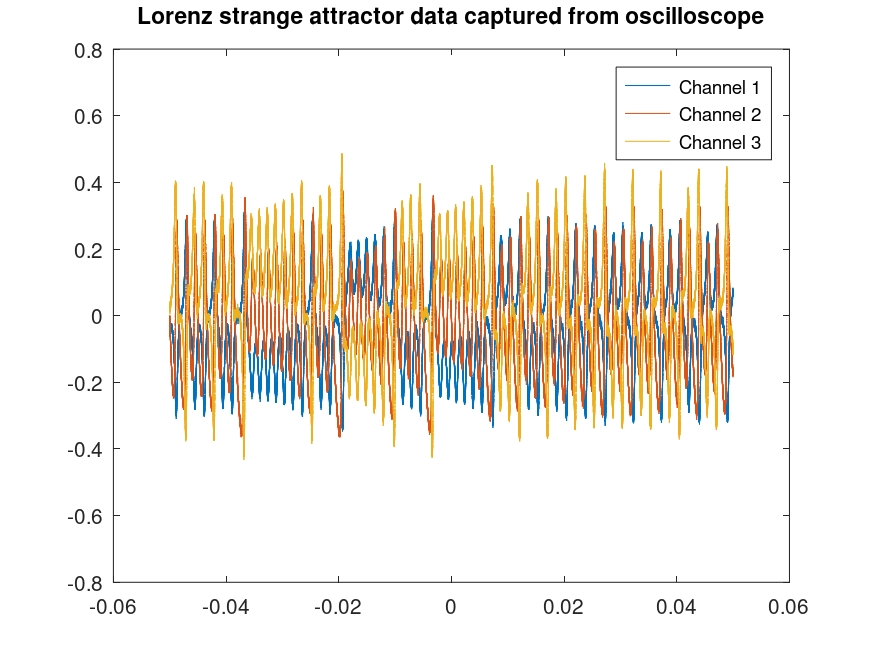
figure(1, "visible", "off");
[ch1d, per, tdat] = readDHO4k("ch1.pre", "ch1.dat");
[ch2d] = readDHO4k("ch2.pre", "ch2.dat");
[ch3d] = readDHO4k("ch3.pre", "ch3.dat");
plot(tdat, ch1d);
hold on;
plot(tdat, ch2d);
plot(tdat, ch3d);
title("Lorenz strange attractor data captured from oscilloscope");
legend("Channel 1", "Channel 2", "Channel 3");
hold off;
print -dpng ex-nb02-ts.png;
ans = "ex-nb02-ts.png";
4. Octave/Matlab: The Waveforms in 3D
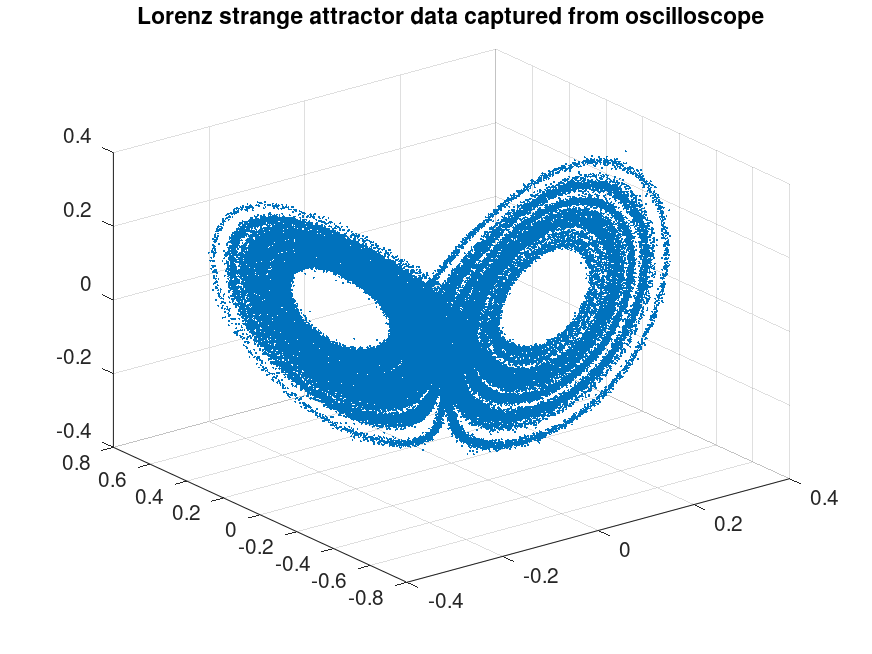
figure(1, "visible", "off");
[ch1d, per, tdat] = readDHO4k("ch1.pre", "ch1.dat");
[ch2d] = readDHO4k("ch2.pre", "ch2.dat");
[ch3d] = readDHO4k("ch3.pre", "ch3.dat");
scatter3(ch1d, ch3d, ch2d, 1, 'filled')
title("Lorenz strange attractor data captured from oscilloscope");
print -dpng ex-nb02-3d.png;
ans = "ex-nb02-3d.png";
5. Animate via Paraview
Before we can load the data up into Paraview we need to convert it from the raw oscilloscope data into something Paraview can read. Probably the easiest thing is CSV. The following bit of Bourne shell code will do the trick:
dhoRAW2CSV.rb -p ch1.pre ch1.dat -o ch1.csv
dhoRAW2CSV.rb -p ch2.pre ch2.dat -o ch2.csv
dhoRAW2CSV.rb -p ch3.pre ch3.dat -o ch3.csv
paste.exe ch1.csv ch2.csv ch3.csv | sed 's/\t/,/g' | cut -d, -f1,2,4,6 | sed 's/v,v,v/c1,c2,c3/' > ch123.csv
This will produce several files:
ch1.csv: CSV with Channel 1 datach2.csv: CSV with Channel 2 datach3.csv: CSV with Channel 3 datach123.csv: Combined CSV with Channel 1 to 3 data
Now we can load up that last file into Paraview, and see a pretty animation of our data:

.. END Excerpt .. END Excerpt .. END Excerpt .. END Excerpt .. END Excerpt ..